Copyright
©The Author(s) 2017.
World J Gastrointest Endosc. Jul 16, 2017; 9(7): 310-318
Published online Jul 16, 2017. doi: 10.4253/wjge.v9.i7.310
Published online Jul 16, 2017. doi: 10.4253/wjge.v9.i7.310
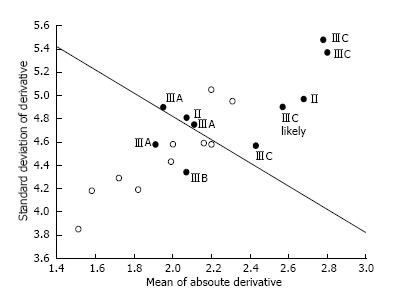
Figure 5 Scatterplot of celiac (black circles) vs control (open circles) patient topographic data.
The ordinate scale gives the standard deviation of the derivative in elevation. The abscissa shows the absolute value of the derivative in elevation. A linear discriminant function mostly separates celiac vs control patient parameter values (black line). Based on the scatterplot, the topography of celiac three-dimensional constructs is typically greater than for controls.
- Citation: Ciaccio EJ, Bhagat G, Lewis SK, Green PH. Use of shape-from-shading to characterize mucosal topography in celiac disease videocapsule images. World J Gastrointest Endosc 2017; 9(7): 310-318
- URL: https://www.wjgnet.com/1948-5190/full/v9/i7/310.htm
- DOI: https://dx.doi.org/10.4253/wjge.v9.i7.310


