Copyright
©The Author(s) 2016.
World J Gastrointest Endosc. Aug 10, 2016; 8(15): 517-532
Published online Aug 10, 2016. doi: 10.4253/wjge.v8.i15.517
Published online Aug 10, 2016. doi: 10.4253/wjge.v8.i15.517
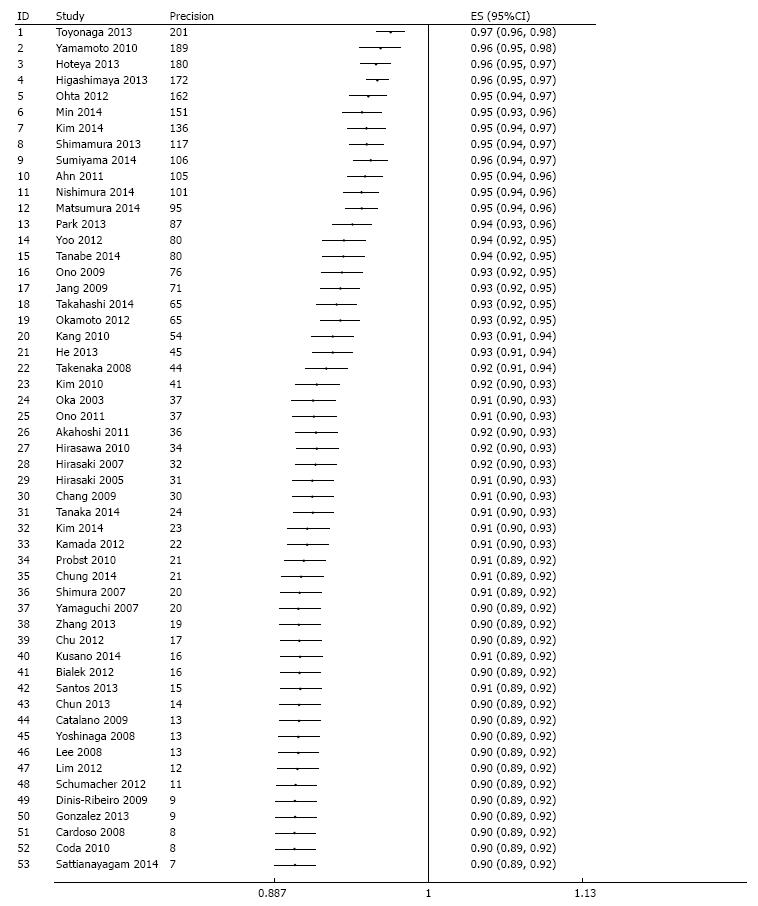
Figure 5 Evaluation of potential publication bias via a cumulative meta-analysis plotted as a function of study precision.
The dots and the error bars correspond to the cumulative estimates and associated 95%CI respectively. After sorting by precision (calculated as inverse of standard error) from most precise to least precise study, a variance - weighted method was used to obtain cumulative meta-analysis estimates by adding one study at a time. Analysis begins with the most precise study; thereafter, effect estimate from the next study in order of decreasing precision are added at each step in the analysis and cumulative estimate and 95%CI is recalculated until the least precise study is added.
- Citation: Akintoye E, Obaitan I, Muthusamy A, Akanbi O, Olusunmade M, Levine D. Endoscopic submucosal dissection of gastric tumors: A systematic review and meta-analysis. World J Gastrointest Endosc 2016; 8(15): 517-532
- URL: https://www.wjgnet.com/1948-5190/full/v8/i15/517.htm
- DOI: https://dx.doi.org/10.4253/wjge.v8.i15.517


