Copyright
©2013 Baishideng Publishing Group Co.
World J Gastrointest Endosc. Jul 16, 2013; 5(7): 313-322
Published online Jul 16, 2013. doi: 10.4253/wjge.v5.i7.313
Published online Jul 16, 2013. doi: 10.4253/wjge.v5.i7.313
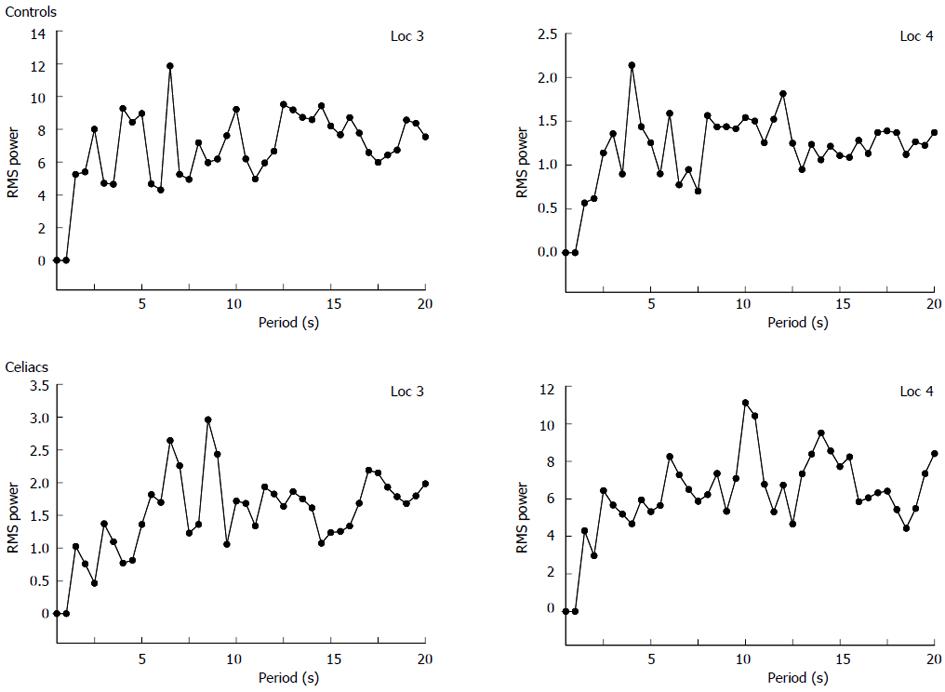
Figure 5 Examples of frequency spectra for celiac vs control.
The dominant period (DP) is the highest peak in the physiologic range, taken as 1-20 s per oscillation. The graphs are shown for locations 3 and 4 in the small intestine. In the control patient the DP is 6 and 5 s for location 3 and 4, respectively. In the celiac patient the DP is 9 and 10 s for location 3 and 4, respectively. Thus the DP is higher for the celiac patient.
- Citation: Ciaccio EJ, Tennyson CA, Bhagat G, Lewis SK, Green PH. Implementation of a polling protocol for predicting celiac disease in videocapsule analysis. World J Gastrointest Endosc 2013; 5(7): 313-322
- URL: https://www.wjgnet.com/1948-5190/full/v5/i7/313.htm
- DOI: https://dx.doi.org/10.4253/wjge.v5.i7.313


