Copyright
©The Author(s) 2025.
World J Gastrointest Endosc. Apr 16, 2025; 17(4): 104097
Published online Apr 16, 2025. doi: 10.4253/wjge.v17.i4.104097
Published online Apr 16, 2025. doi: 10.4253/wjge.v17.i4.104097
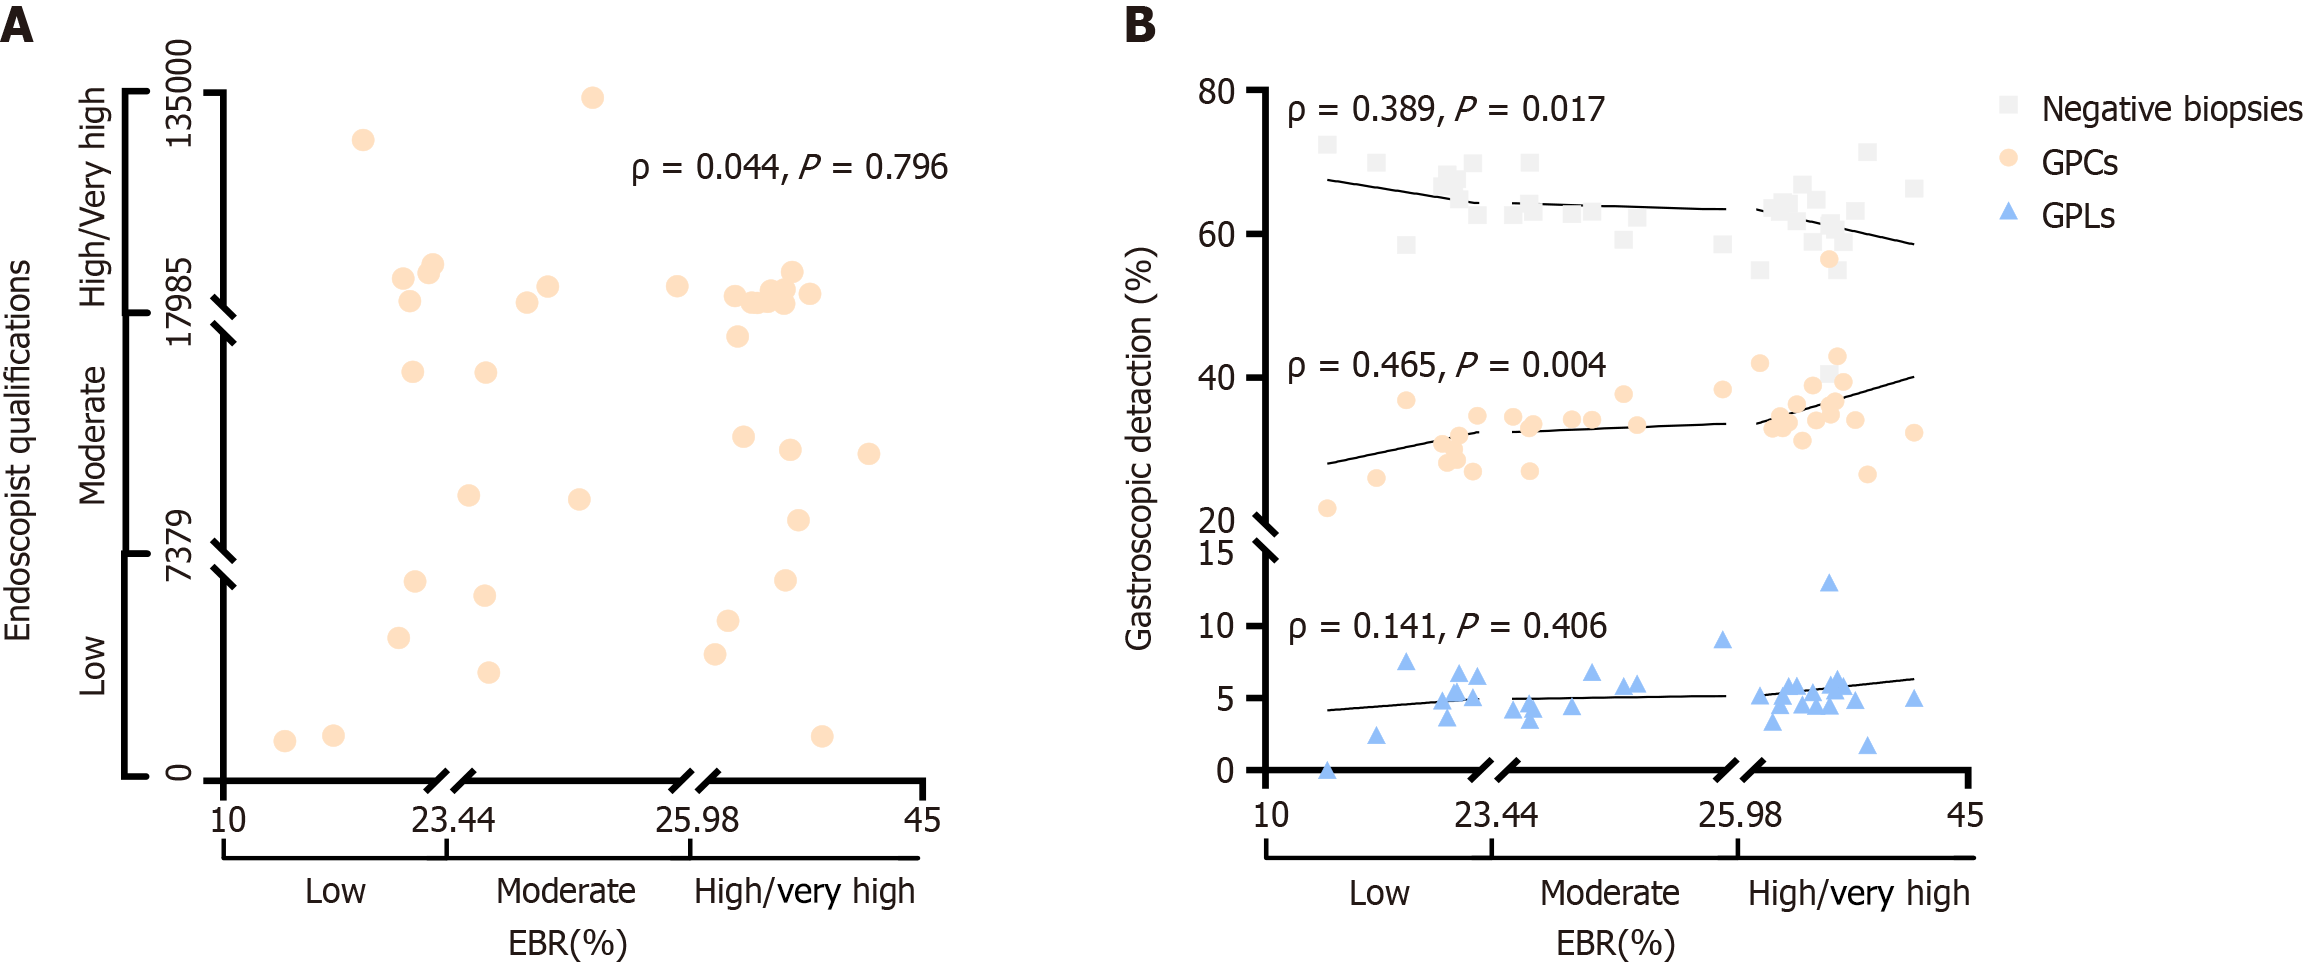
Figure 3 Relationships between endoscopist biopsy rate, endoscopist qualifications and endoscopic detection.
A: The relationship between endoscopist biopsy rate (EBR) and endoscopist qualifications is shown. The horizontal axis represents different groups of EBR (low, moderate, high/very high), and the vertical axis represents different groups of endoscopist qualifications (low, moderate, high/very high); B: The relationship between EBR and the positive detection rate is shown. The horizontal axis represents different EBR groups (low, moderate, high/very high), and the vertical axis represents endoscopic detection rates for different diseases (%). ρ: Spearman’s correlation coefficient. P < 0.05 indicates statistical significance. EBR: Endoscopist biopsy rate; GPCs: Gastric precancerous conditions; GPLs: Gastric precancerous lesions.
- Citation: Shen Y, Gao XJ, Zhang XX, Zhao JM, Hu FF, Han JL, Tian WY, Yang M, Wang YF, Lv JL, Zhan Q, An FM. Endoscopists and endoscopic assistants’ qualifications, but not their biopsy rates, improve gastric precancerous lesions detection rate. World J Gastrointest Endosc 2025; 17(4): 104097
- URL: https://www.wjgnet.com/1948-5190/full/v17/i4/104097.htm
- DOI: https://dx.doi.org/10.4253/wjge.v17.i4.104097


