Copyright
©The Author(s) 2025.
World J Gastrointest Endosc. Jan 16, 2025; 17(1): 101382
Published online Jan 16, 2025. doi: 10.4253/wjge.v17.i1.101382
Published online Jan 16, 2025. doi: 10.4253/wjge.v17.i1.101382
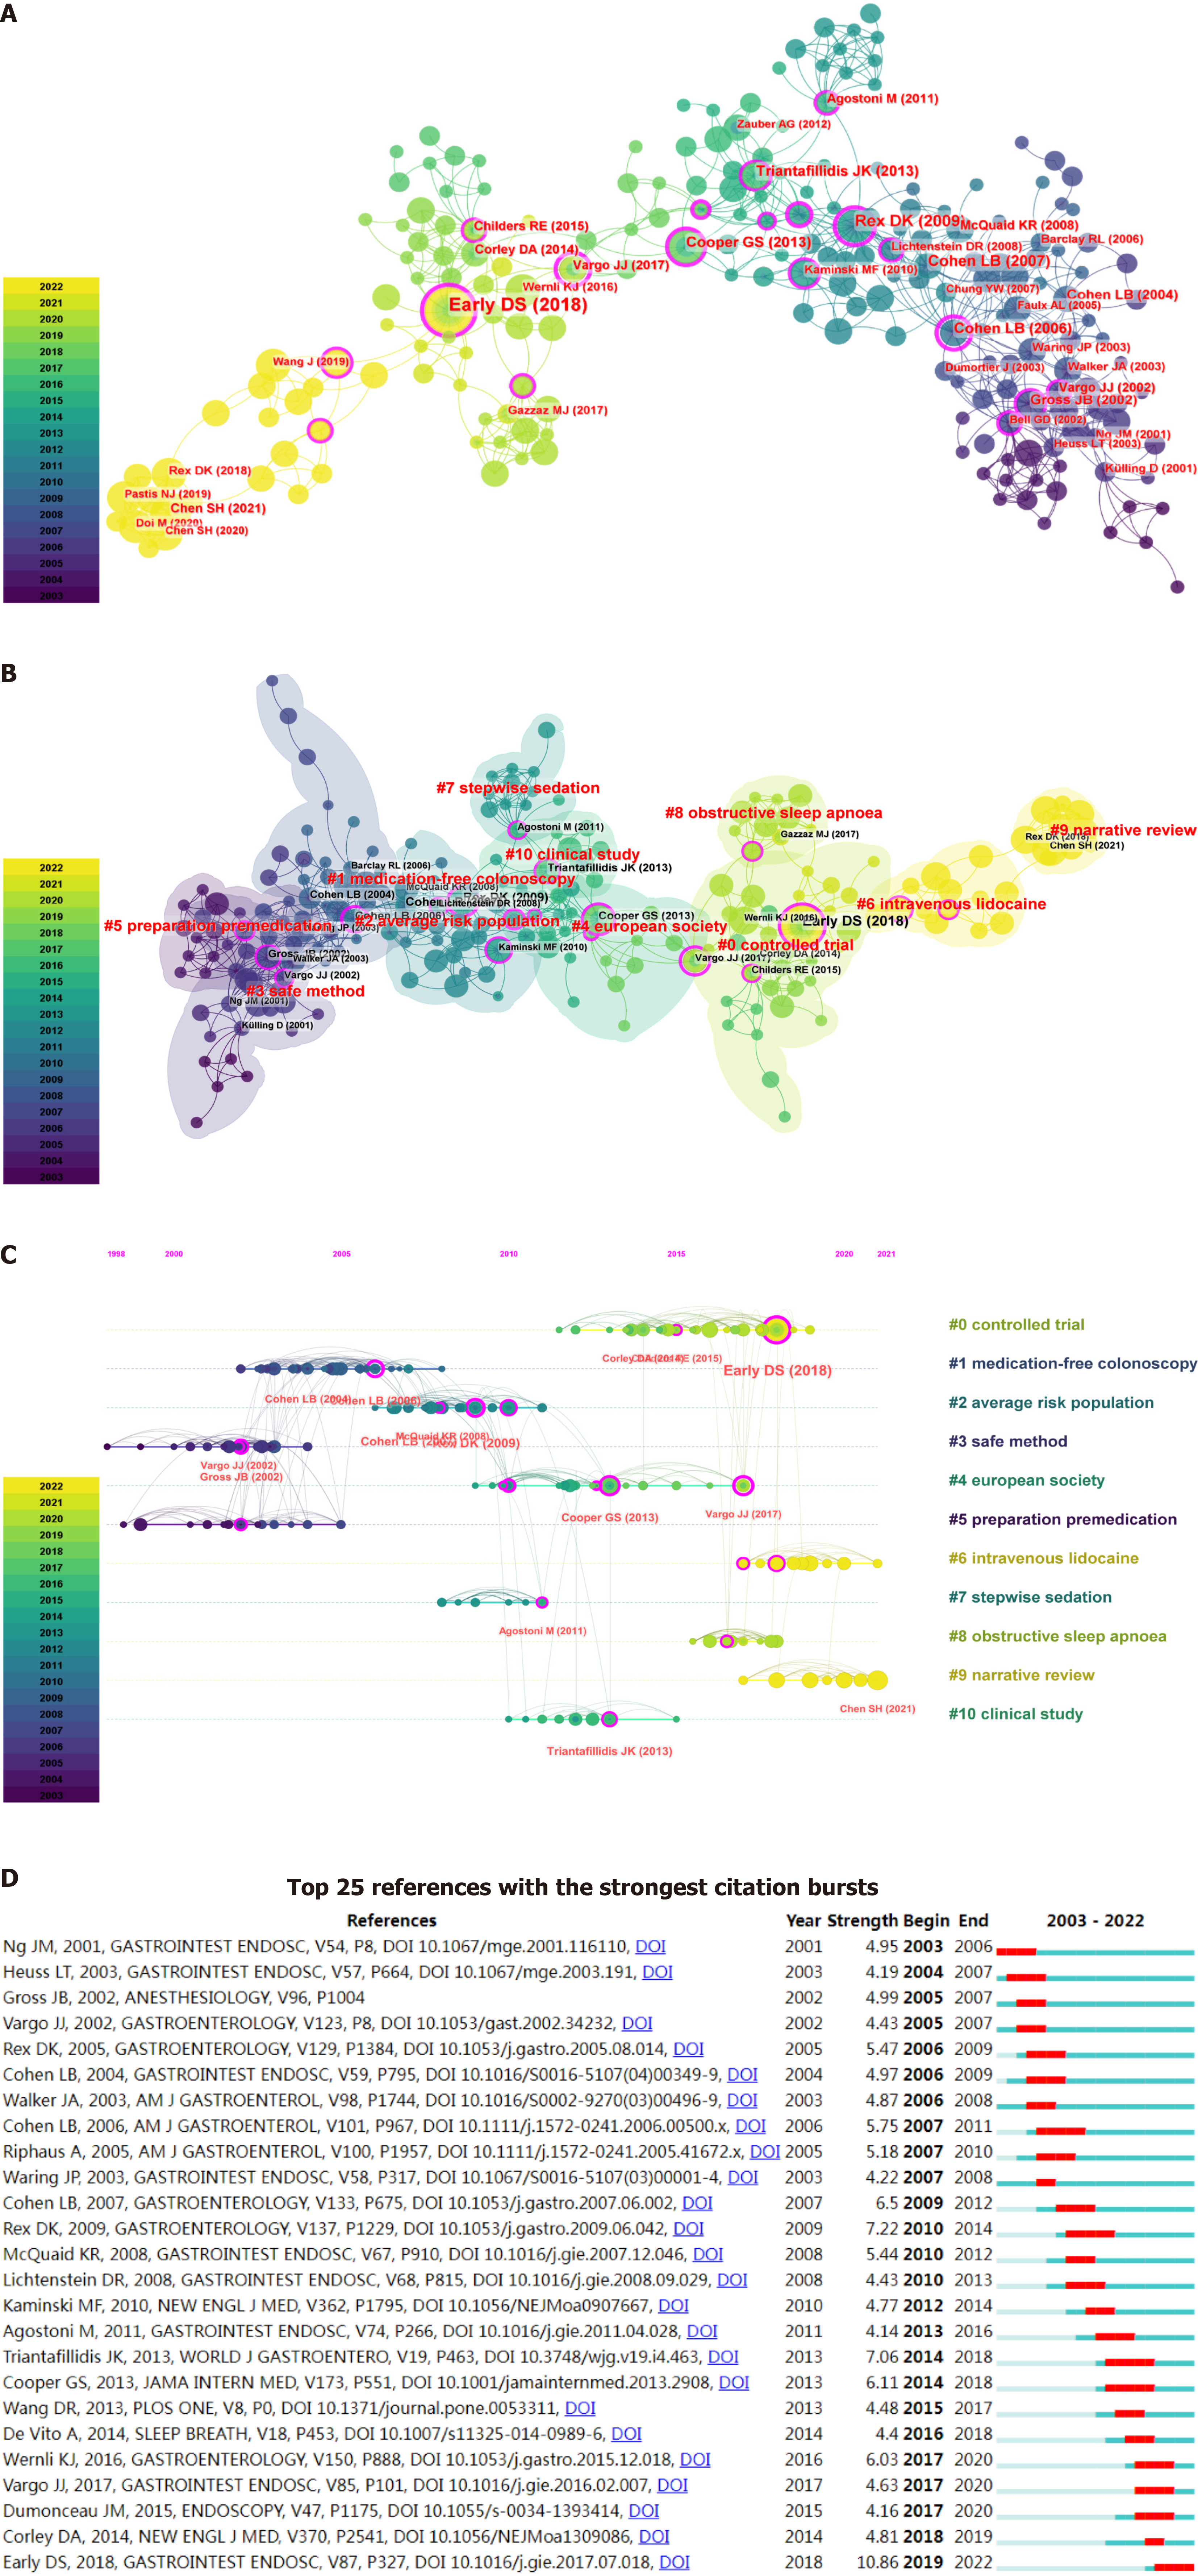
Figure 5 Analysis of research hotspots.
A: Map of co-cited references; B: Cluster network diagram of co-cited references; C: Timeline visualization of co-cited clusters featuring their labels; D: The 25 references exhibiting the highest citation bursts.
- Citation: Wang G, Zhen B, Li JJ, Jin CN, Jia J, Liu BH, Bai YH. Insights into anesthesia administration for elderly individuals undergoing painless gastroenteroscopy: A bibliometric study. World J Gastrointest Endosc 2025; 17(1): 101382
- URL: https://www.wjgnet.com/1948-5190/full/v17/i1/101382.htm
- DOI: https://dx.doi.org/10.4253/wjge.v17.i1.101382


