Copyright
©The Author(s) 2021.
World J Gastrointest Endosc. May 16, 2021; 13(5): 137-154
Published online May 16, 2021. doi: 10.4253/wjge.v13.i5.137
Published online May 16, 2021. doi: 10.4253/wjge.v13.i5.137
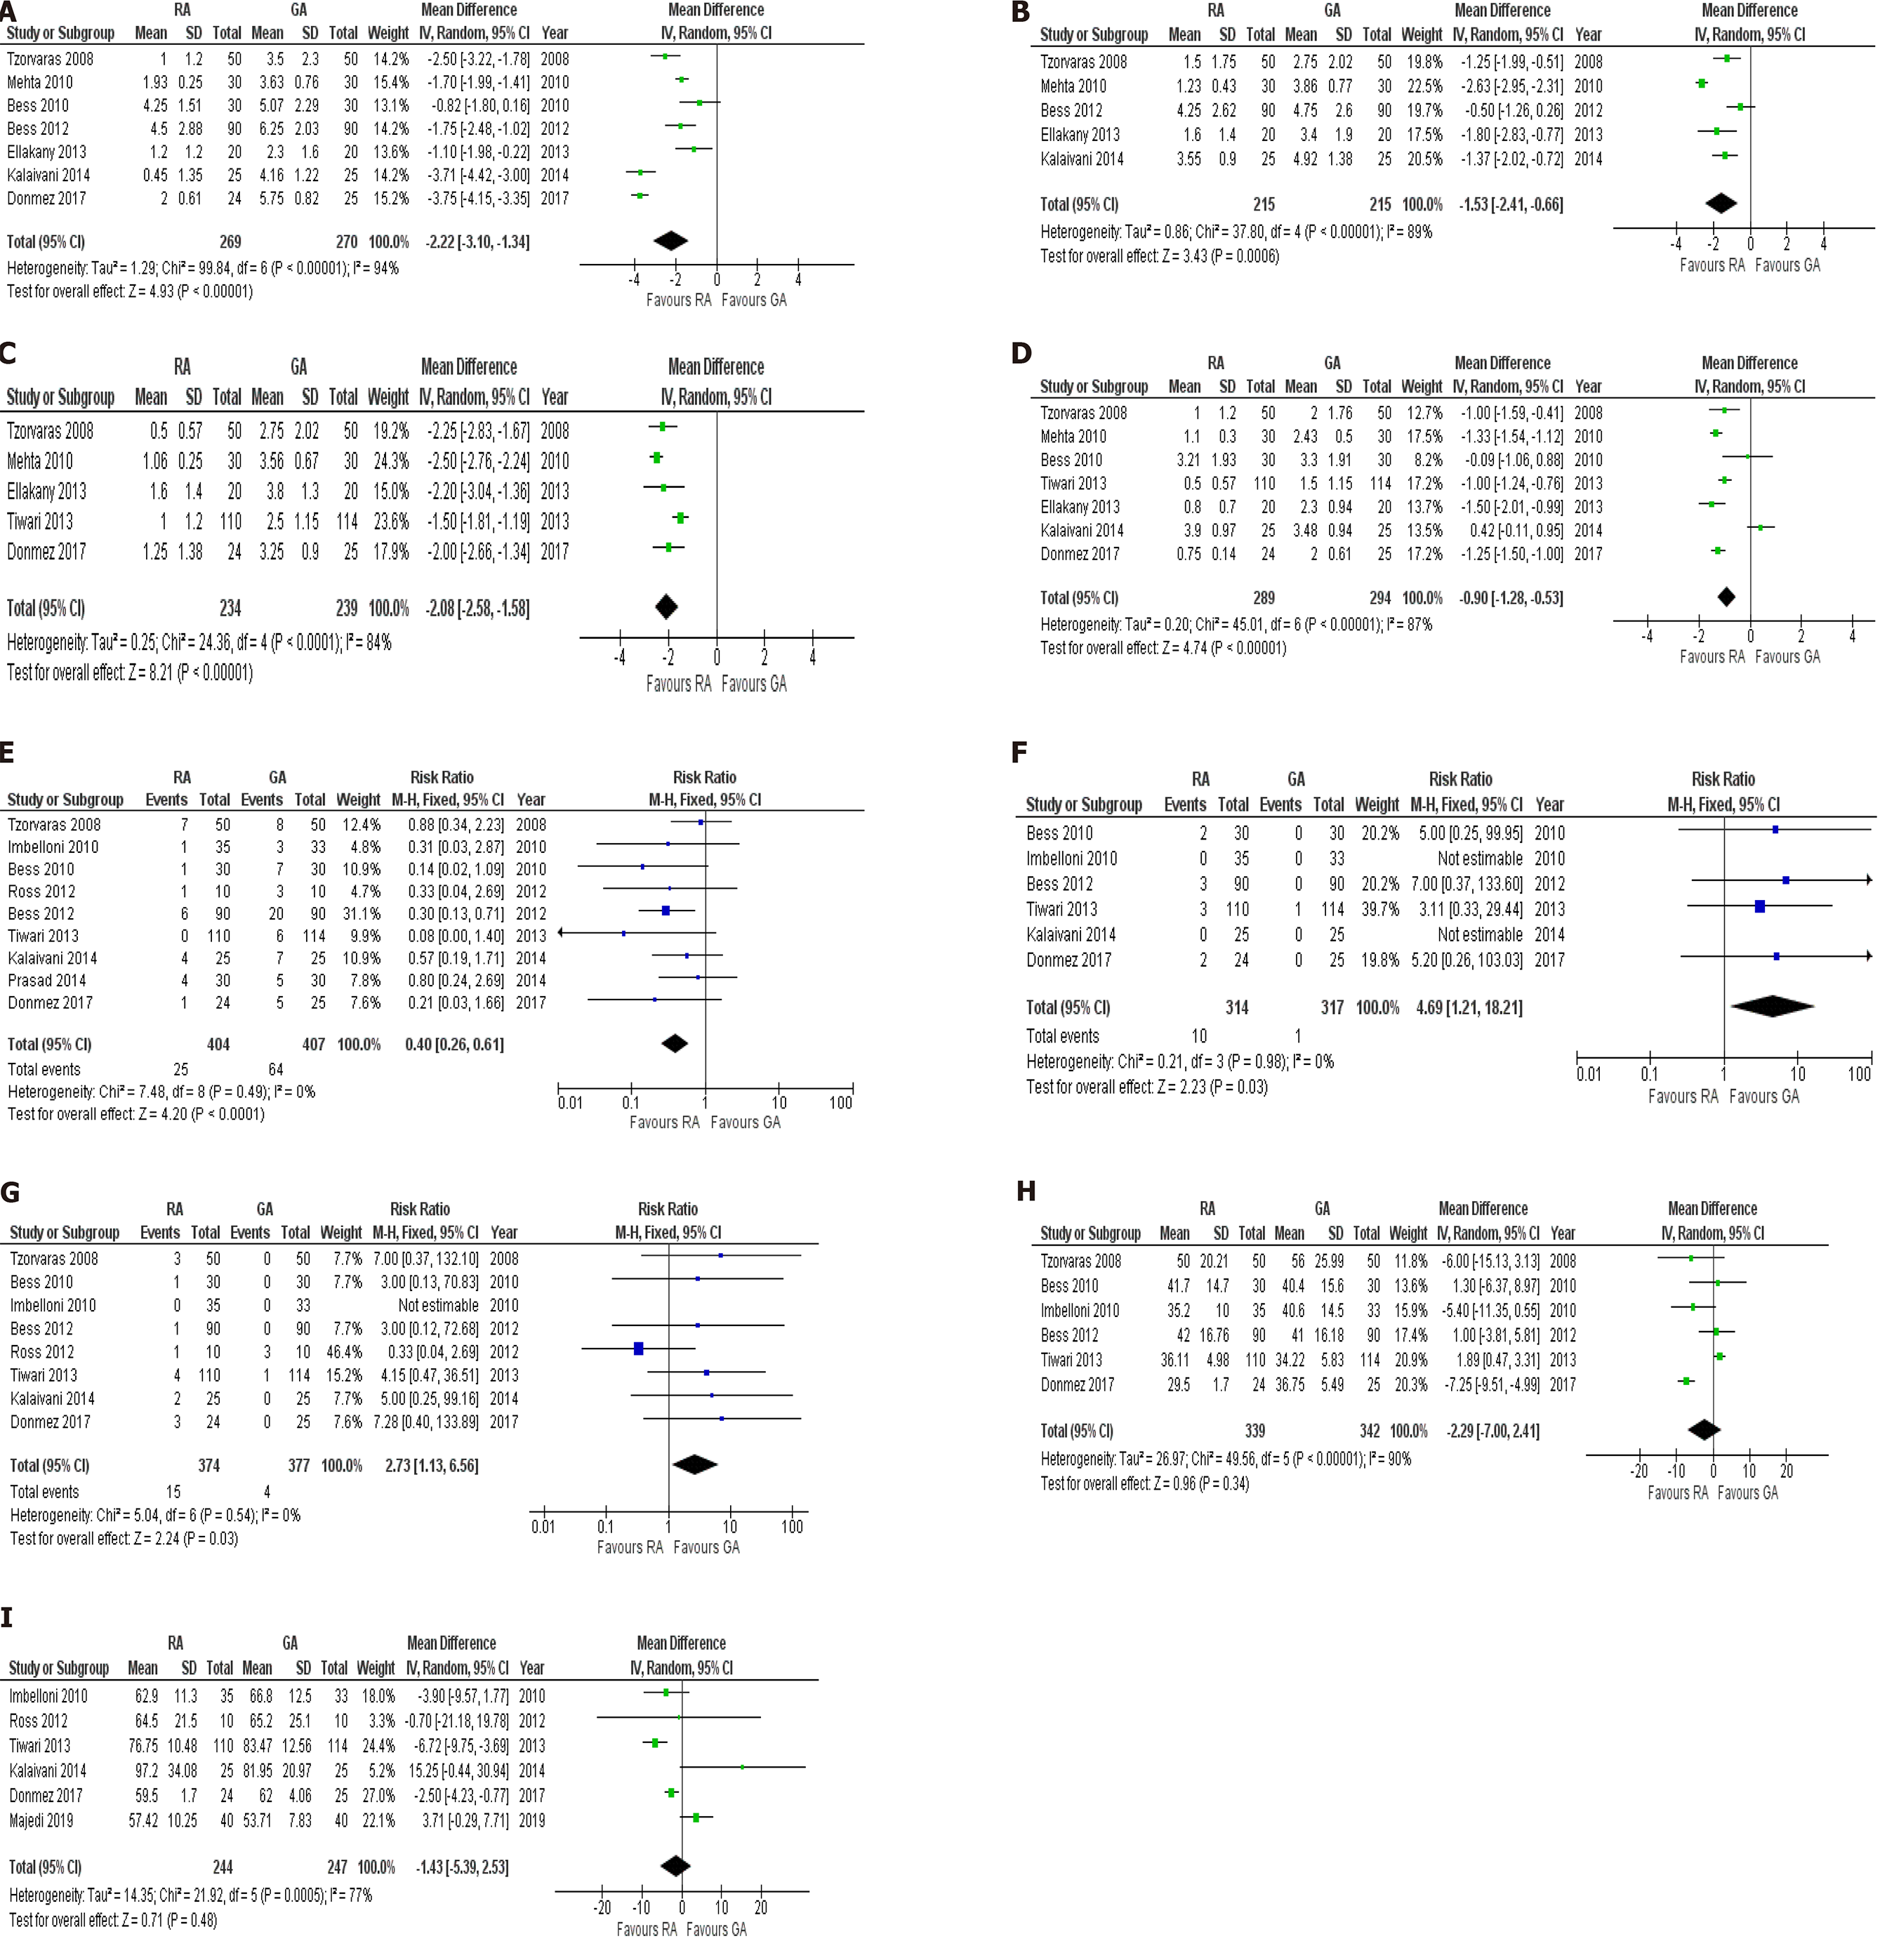
Figure 3 Forest plots of comparison.
A: Visual analogue scale (VAS) at 4 h; B: VAS at 8 h; C: VAS at 12 h; D: VAS at 24 h; E: Nausea and vomiting; F: Headache; G: Urinary retention; H: Operative time; I: Total operative and anesthetic. The solid squares denote the risk ratios or mean difference. The horizontal lines represent the 95% confidence intervals, and the diamond denotes the pooled effect size. M-H: Mantel Haenszel test; RA: Regional anesthesia; GA: General anesthesia; CI: Confidence interval; SD: Standard deviation.
- Citation: Asaad P, O’Connor A, Hajibandeh S, Hajibandeh S. Meta-analysis and trial sequential analysis of randomized evidence comparing general anesthesia vs regional anesthesia for laparoscopic cholecystectomy. World J Gastrointest Endosc 2021; 13(5): 137-154
- URL: https://www.wjgnet.com/1948-5190/full/v13/i5/137.htm
- DOI: https://dx.doi.org/10.4253/wjge.v13.i5.137


