Copyright
©The Author(s) 2017.
World J Hepatol. Mar 18, 2017; 9(8): 443-454
Published online Mar 18, 2017. doi: 10.4254/wjh.v9.i8.443
Published online Mar 18, 2017. doi: 10.4254/wjh.v9.i8.443
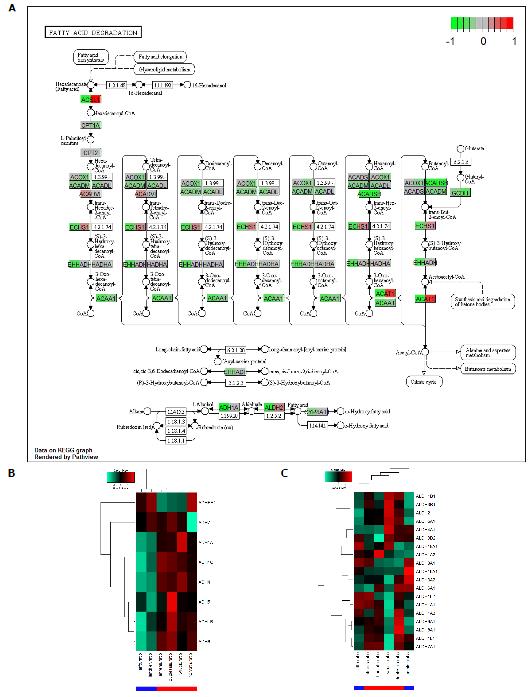
Figure 3 Fatty acid degradation is down-regulated in alcoholic liver disease and non-alcoholic fatty liver disease but more pronounced in alcoholic liver disease.
A: The KEGG graph shows down-regulation (green) in nearly all genes for ALD (left part of the gene boxes) while for NAFLD (right part of the gene boxes) there are up-regulated genes such as ACSL1 and ACAT1 but more are down-regulated. Interestingly, in alcohol metabolism at the bottom of the chart, genes are down-regulated in ALD. Alcohol metabolism at the bottom of (A) is shown in detail in the alcohol dehydrogenase (ADH) genes in the heatmap in (B) and in the aldehyde dehydrogenase genes in (C). ADHs are down-regulated in ALD while only dedicated ALDHs, e.g., ALDH2 are down-regulated in ALD. ALD: Alcoholic liver disease; NAFLD: Non-alcoholic fatty liver disease.
- Citation: Wruck W, Adjaye J. Meta-analysis reveals up-regulation of cholesterol processes in non-alcoholic and down-regulation in alcoholic fatty liver disease. World J Hepatol 2017; 9(8): 443-454
- URL: https://www.wjgnet.com/1948-5182/full/v9/i8/443.htm
- DOI: https://dx.doi.org/10.4254/wjh.v9.i8.443


