Copyright
©The Author(s) 2017.
World J Hepatol. Mar 18, 2017; 9(8): 418-426
Published online Mar 18, 2017. doi: 10.4254/wjh.v9.i8.418
Published online Mar 18, 2017. doi: 10.4254/wjh.v9.i8.418
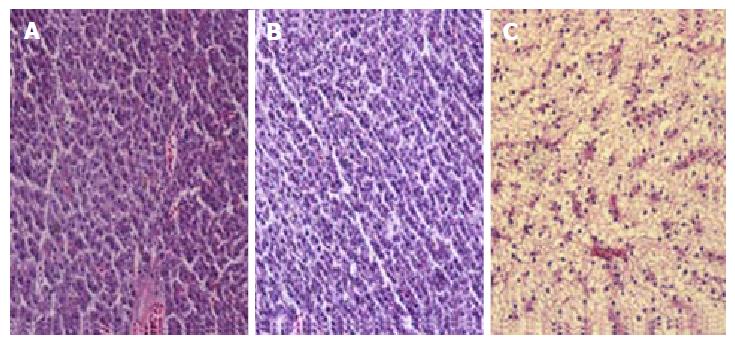
Figure 1 Hematoxylin-eosin staining of liver sections from zebrafish.
A: C group (2 wk), the hepatocytes are aligned in cords, absence of fat droplets; B: E group (2 wk), without apparent changes compared with the C group; C: E group (4 wk), enlarged hepatocytes due to fatty infiltration. Magnification: 400 ×.
- Citation: Schneider ACR, Gregório C, Uribe-Cruz C, Guizzo R, Malysz T, Faccioni-Heuser MC, Longo L, da Silveira TR. Chronic exposure to ethanol causes steatosis and inflammation in zebrafish liver. World J Hepatol 2017; 9(8): 418-426
- URL: https://www.wjgnet.com/1948-5182/full/v9/i8/418.htm
- DOI: https://dx.doi.org/10.4254/wjh.v9.i8.418


