Copyright
©The Author(s) 2017.
World J Hepatol. Feb 8, 2017; 9(4): 191-208
Published online Feb 8, 2017. doi: 10.4254/wjh.v9.i4.191
Published online Feb 8, 2017. doi: 10.4254/wjh.v9.i4.191
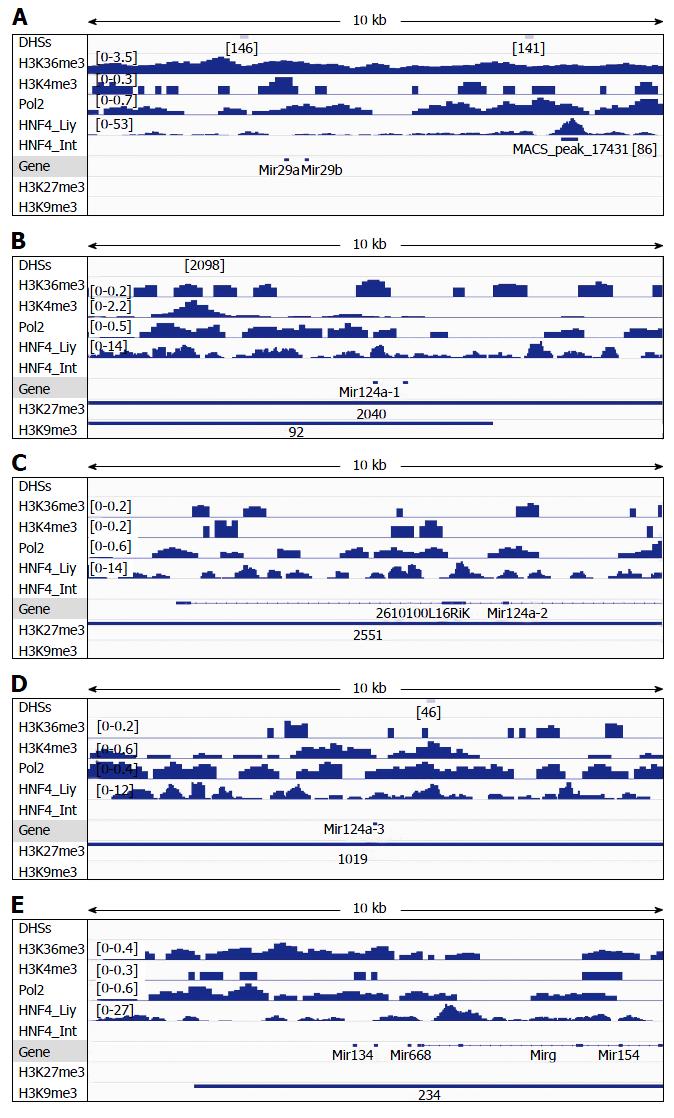
Figure 5 Analysis of DNAse-I hypersensitive sites as well as DNA-binding of HNF4α, RNA polymerase II (Pol2), and methylated histones to loci of miR-29a/miR-29b (A), miR-124a-1 (B), miR-124a-2 (C), miR-124a-3 (D) and miR-134 (E) in wildtype mouse liver.
DNA-binding of HNF4α to these microRNA loci in the mouse small intestine (HNF4α _Int) was compared to those in the mouse liver (HNF4α_Liv). Data of DHSs (determined by DNAse-seq) and DNA-binding of proteins (determined by ChIP-seq) were retrieved from the public database of GEO DataSets and visualized in the IGV software. The peak values/ranges for each mark were shown in square brackets or under the line mark. DHSs: DNAse-I hypersensitive sites; H3K36me3: H3 trimethylation at lysine-36; H3K4me3: H3 trimethylation at lysine-4; H3K27me3: H3 trimethylation at lysine-27; H3K9me3: H3 trimethylation at lysine-9; Pol2: Polymerase 2; HNF4α: Hepatocyte nuclear factor 4 alpha; ChIP-seq: Chromatin immunoprecipitation-sequencing; IGV: Integrative genomics viewer.
- Citation: Lu H, Lei X, Liu J, Klaassen C. Regulation of hepatic microRNA expression by hepatocyte nuclear factor 4 alpha. World J Hepatol 2017; 9(4): 191-208
- URL: https://www.wjgnet.com/1948-5182/full/v9/i4/191.htm
- DOI: https://dx.doi.org/10.4254/wjh.v9.i4.191


