Copyright
©The Author(s) 2017.
World J Hepatol. Feb 8, 2017; 9(4): 191-208
Published online Feb 8, 2017. doi: 10.4254/wjh.v9.i4.191
Published online Feb 8, 2017. doi: 10.4254/wjh.v9.i4.191
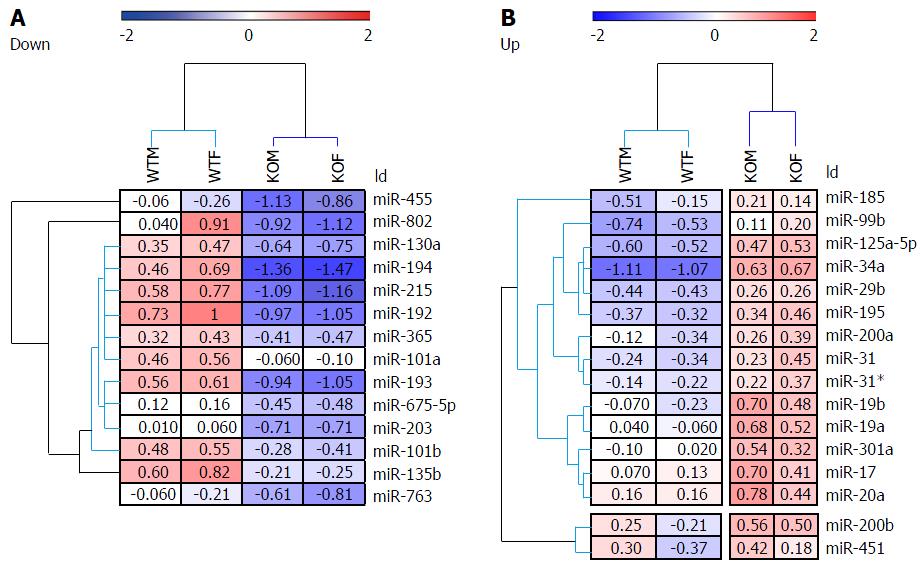
Figure 1 Heat map and unsupervised hierarchical clustering of hepatic microRNAs in male and female Hnf4a-LivKO mice.
The heat map diagram shows the results of the 2-way hierarchical clustering of microRNAs and samples. Each row represents a microRNA and each column represents a pooled liver sample. The microRNA clustering tree is shown on the left, and the sample clustering tree appears at the top. The color scale shown at the top illustrates the relative expression level of a microRNA across all samples: Red color represents an expression level above mean, blue color represents expression lower than the mean. The clustering is performed on log2(Hy3/Hy5) ratios which passed the filtering criteria on variation across samples; LogMedianDRatios differencies > 0.58, corresponding to 50% differential expression. WTM: Wild-type male; WTF: Wild-type female; KOM: Knockout male; KOF: Knockout female.
- Citation: Lu H, Lei X, Liu J, Klaassen C. Regulation of hepatic microRNA expression by hepatocyte nuclear factor 4 alpha. World J Hepatol 2017; 9(4): 191-208
- URL: https://www.wjgnet.com/1948-5182/full/v9/i4/191.htm
- DOI: https://dx.doi.org/10.4254/wjh.v9.i4.191


