Copyright
©The Author(s) 2017.
World J Hepatol. Dec 28, 2017; 9(36): 1367-1371
Published online Dec 28, 2017. doi: 10.4254/wjh.v9.i36.1367
Published online Dec 28, 2017. doi: 10.4254/wjh.v9.i36.1367
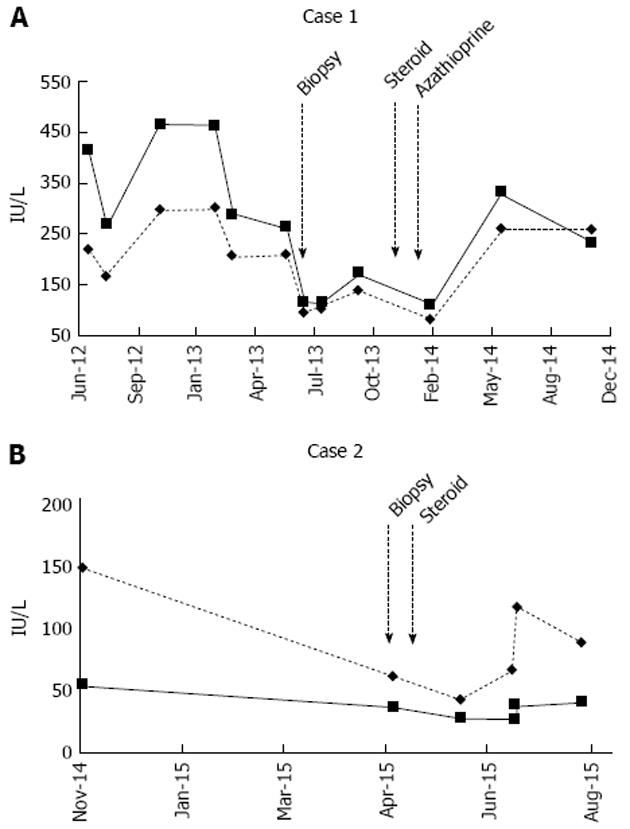
Figure 2 Graphical representation of alanine transferase (straight line) and aspartate transaminase (dashed line) over time (A and B).
Time of biopsy and treatment also denoted.
- Citation: Ofori E, Ramai D, Ona MA, Reddy M. Autoimmune hepatitis in the setting of human immunodeficiency virus infection: A case series. World J Hepatol 2017; 9(36): 1367-1371
- URL: https://www.wjgnet.com/1948-5182/full/v9/i36/1367.htm
- DOI: https://dx.doi.org/10.4254/wjh.v9.i36.1367


