Copyright
©The Author(s) 2017.
World J Hepatol. Dec 8, 2017; 9(34): 1261-1269
Published online Dec 8, 2017. doi: 10.4254/wjh.v9.i34.1261
Published online Dec 8, 2017. doi: 10.4254/wjh.v9.i34.1261
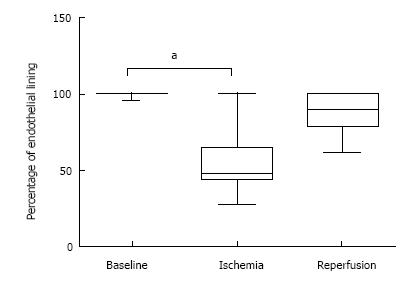
Figure 3 Morphometric analysis of endothelial lining.
The percentage of attached endothelial lining along sinusoidal walls was quantified using network information services elements Basic Research Software. Statistical analysis was performed in Graphpad Prism, and differences were determined by the non-parametric Friedman test followed by Dunn’s post-hoc test (P < 0.01). Baseline: Before induction of ischemia; Ischemia: Twenty minutes of ischemia; Reperfusion: Twenty minutes after reperfusion.
- Citation: Jawad R, D’souza M, Selenius LA, Lundgren MW, Danielsson O, Nowak G, Björnstedt M, Isaksson B. Morphological alterations and redox changes associated with hepatic warm ischemia-reperfusion injury. World J Hepatol 2017; 9(34): 1261-1269
- URL: https://www.wjgnet.com/1948-5182/full/v9/i34/1261.htm
- DOI: https://dx.doi.org/10.4254/wjh.v9.i34.1261


