Copyright
©The Author(s) 2017.
World J Hepatol. Nov 18, 2017; 9(32): 1227-1238
Published online Nov 18, 2017. doi: 10.4254/wjh.v9.i32.1227
Published online Nov 18, 2017. doi: 10.4254/wjh.v9.i32.1227
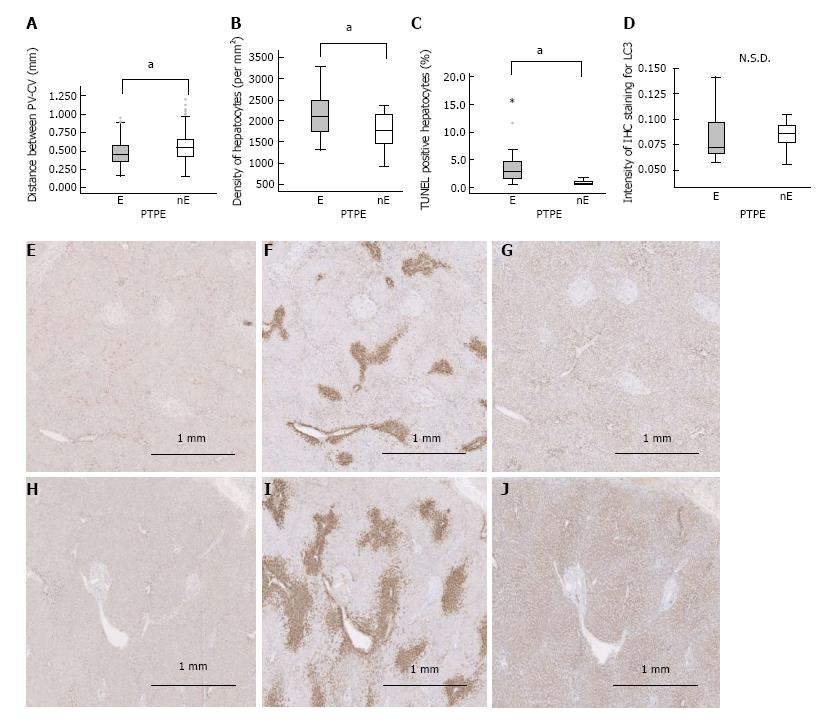
Figure 6 Human specimens.
A: The distance between the portal vein and central vein; B: Hepatocyte density; C: Fraction of TUNEL-positive hepatocytes differed significantly between embolized and nonembolized lobes; D: Intensity of IHC staining for LC3; E-J: IHC for LC3 (E, H), GS (F, I), and CYP2E1 (G, J). LC3 expression did not differ significantly (D) between the embolized (E) and the nonembolized area (H), but the zonation of GS and CYP2E1 was narrower in the embolized lobe (F, G) than the nonembolized lobe (I, J). aP ≤ 0.001. N.S.D: No significant difference; E: Embolized area; nE: Nonembolized area.
- Citation: Iwao Y, Ojima H, Kobayashi T, Kishi Y, Nara S, Esaki M, Shimada K, Hiraoka N, Tanabe M, Kanai Y. Liver atrophy after percutaneous transhepatic portal embolization occurs in two histological phases: Hepatocellular atrophy followed by apoptosis. World J Hepatol 2017; 9(32): 1227-1238
- URL: https://www.wjgnet.com/1948-5182/full/v9/i32/1227.htm
- DOI: https://dx.doi.org/10.4254/wjh.v9.i32.1227


