Copyright
©The Author(s) 2017.
World J Hepatol. Sep 28, 2017; 9(27): 1115-1124
Published online Sep 28, 2017. doi: 10.4254/wjh.v9.i27.1115
Published online Sep 28, 2017. doi: 10.4254/wjh.v9.i27.1115
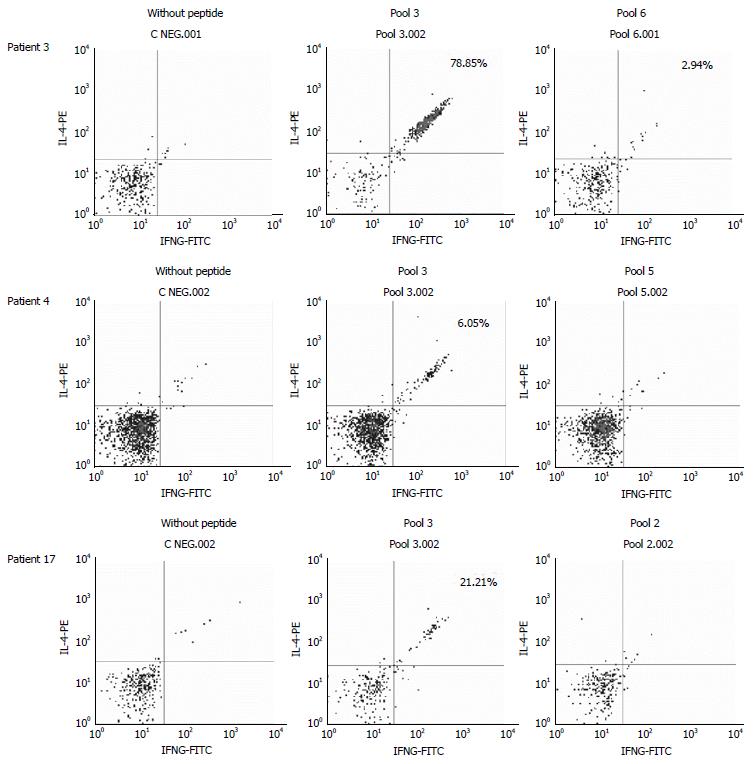
Figure 3 Representative plots showing CD4+CD8low T lymphocyte activation in terms of cytokine production.
Production of IL-4 and/or IFNγ was analyzed after exposure of the cells to the glutathione S-transferase T1 peptides. As an example, patient 3 had 78.85% of the double positive cells activated with pool 3 and 2.9% with pool 6. Patient 4 had 6.05% of cells activated with pool 3, whereas pool 5 did not have any effect. Patient 17 showed 21.21% of cell activation with pool 3, but no response was observed when the cells were cultured with pool 2. In all the cases, the cells produced both cytokines, indicating a Th0 type of response.
- Citation: Martínez-Bravo MJ, Sánchez B, Sousa JM, Acevedo MJ, Gómez-Bravo MA, Núñez-Roldán A, Aguilera I. T-cell allorecognition of donor glutathione S-transferase T1 in plasma cell-rich rejection. World J Hepatol 2017; 9(27): 1115-1124
- URL: https://www.wjgnet.com/1948-5182/full/v9/i27/1115.htm
- DOI: https://dx.doi.org/10.4254/wjh.v9.i27.1115


