Copyright
©The Author(s) 2017.
World J Hepatol. Sep 28, 2017; 9(27): 1115-1124
Published online Sep 28, 2017. doi: 10.4254/wjh.v9.i27.1115
Published online Sep 28, 2017. doi: 10.4254/wjh.v9.i27.1115
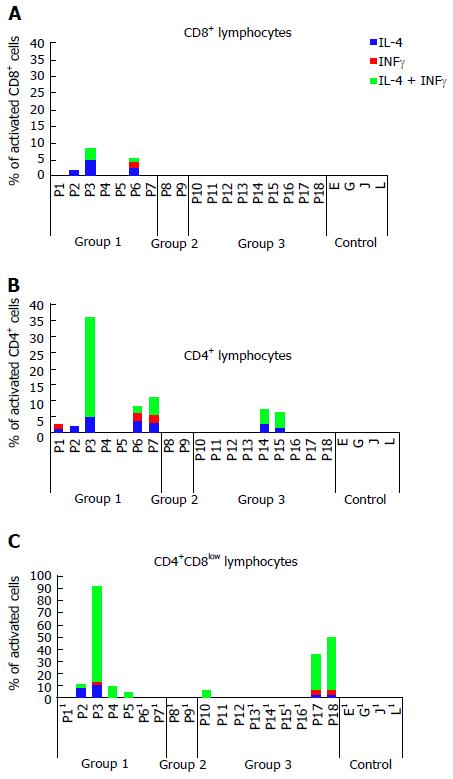
Figure 1 Polyclonal response of T cells upon recall with peptides of the glutathione S-transferase T1 protein.
Percentages of activation upon exposure to the different pools are represented. Three cell types showed activation at different levels. A: Only CD8+ lymphocytes of patients included in group 1 showed activation. The numbers in the figure represent the highest value obtained for each pathway when activation was induced by different pools of peptides; B: Activation of CD4+ lymphocytes was observed in patients of groups 1 and 3; C: CD4+CD8low cells showed the highest percentage of activation. 1Indicate that the analysis could not be performed in these patients.
- Citation: Martínez-Bravo MJ, Sánchez B, Sousa JM, Acevedo MJ, Gómez-Bravo MA, Núñez-Roldán A, Aguilera I. T-cell allorecognition of donor glutathione S-transferase T1 in plasma cell-rich rejection. World J Hepatol 2017; 9(27): 1115-1124
- URL: https://www.wjgnet.com/1948-5182/full/v9/i27/1115.htm
- DOI: https://dx.doi.org/10.4254/wjh.v9.i27.1115


