Copyright
©The Author(s) 2017.
World J Hepatol. Aug 28, 2017; 9(24): 1030-1039
Published online Aug 28, 2017. doi: 10.4254/wjh.v9.i24.1030
Published online Aug 28, 2017. doi: 10.4254/wjh.v9.i24.1030
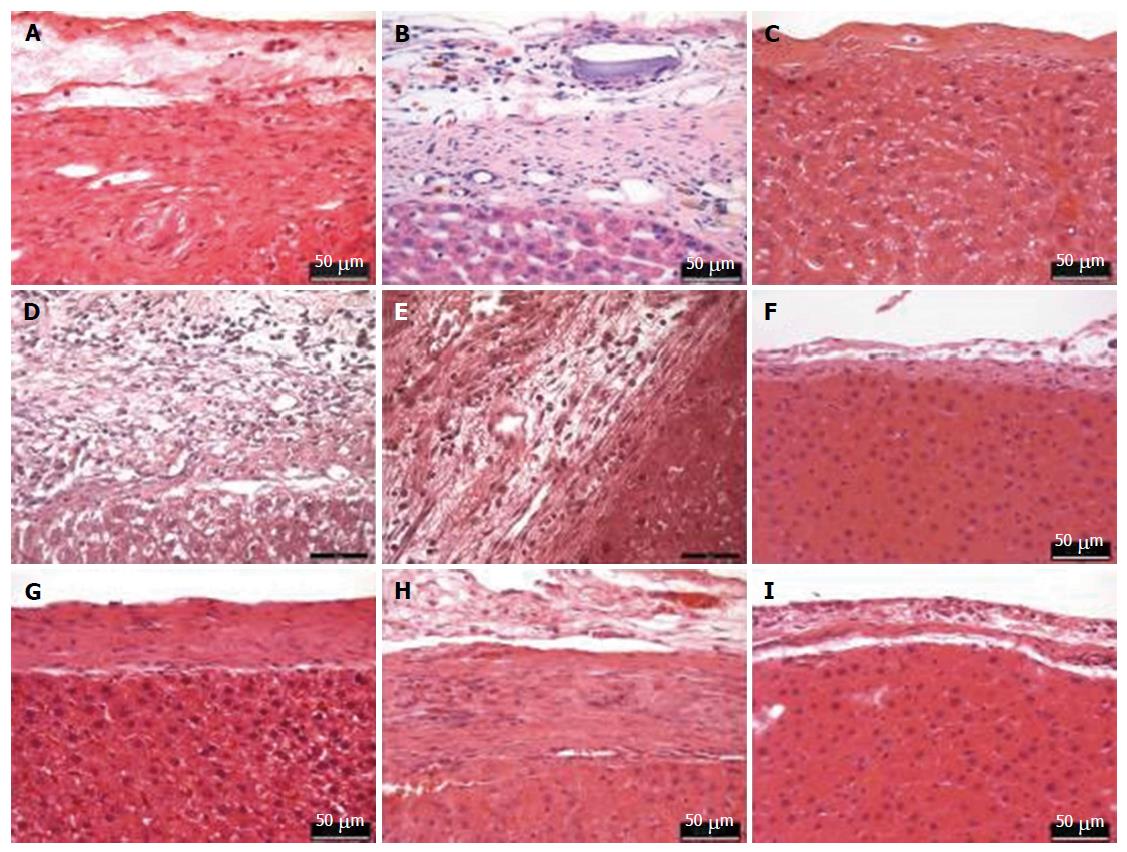
Figure 8 Histopathological evaluations of H and E stained liver tissue section shows the resected area and structural intergrity at different time points, MAR-1 (A: 14 d, B: 21 d, C: 90 d); Fibrin (D: 14 d, E: 21 d, F: 90 d); NaCl (G: 14 d, H: 21 d, I: 90 d).
- Citation: Srinivasan PK, Sperber V, Afify M, Tanaka H, Fukushima K, Kögel B, Gremse F, Tolba R. Novel synthetic adhesive as an effective alternative to Fibrin based adhesives. World J Hepatol 2017; 9(24): 1030-1039
- URL: https://www.wjgnet.com/1948-5182/full/v9/i24/1030.htm
- DOI: https://dx.doi.org/10.4254/wjh.v9.i24.1030


