Copyright
©The Author(s) 2017.
World J Hepatol. Jul 8, 2017; 9(19): 850-856
Published online Jul 8, 2017. doi: 10.4254/wjh.v9.i19.850
Published online Jul 8, 2017. doi: 10.4254/wjh.v9.i19.850
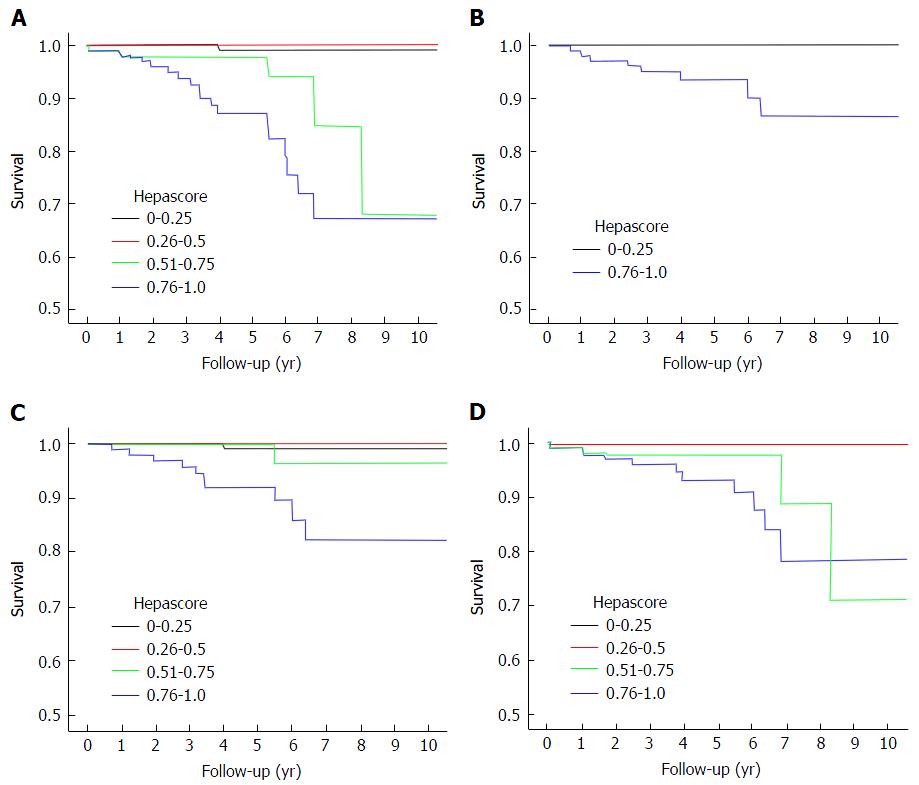
Figure 1 Kaplan-Meier curves specifying survival for liver related death, liver decompensation, hepatocellular carcinoma and a composite end point as a function of baseline Hepascore in the whole cohort.
A: Time to composite end point using baseline Hepascore (P < 0.001); B: Time to LRD according to Hepascore (P < 0.001); C: Time to LD according to Hepascore (P < 0.001); D: Time to HCC according to Hepascore (P < 0.001). LRD: Liver related death; LD: Liver decompensation; HCC: Hepatocellular carcinoma.
- Citation: Jeffrey AW, Huang Y, de Boer WB, Adams LA, MacQuillan G, Speers D, Joseph J, Jeffrey GP. Improved Hepascore in hepatitis C predicts reversal in risk of adverse outcome. World J Hepatol 2017; 9(19): 850-856
- URL: https://www.wjgnet.com/1948-5182/full/v9/i19/850.htm
- DOI: https://dx.doi.org/10.4254/wjh.v9.i19.850


