Copyright
©The Author(s) 2017.
World J Hepatol. May 18, 2017; 9(14): 667-676
Published online May 18, 2017. doi: 10.4254/wjh.v9.i14.667
Published online May 18, 2017. doi: 10.4254/wjh.v9.i14.667
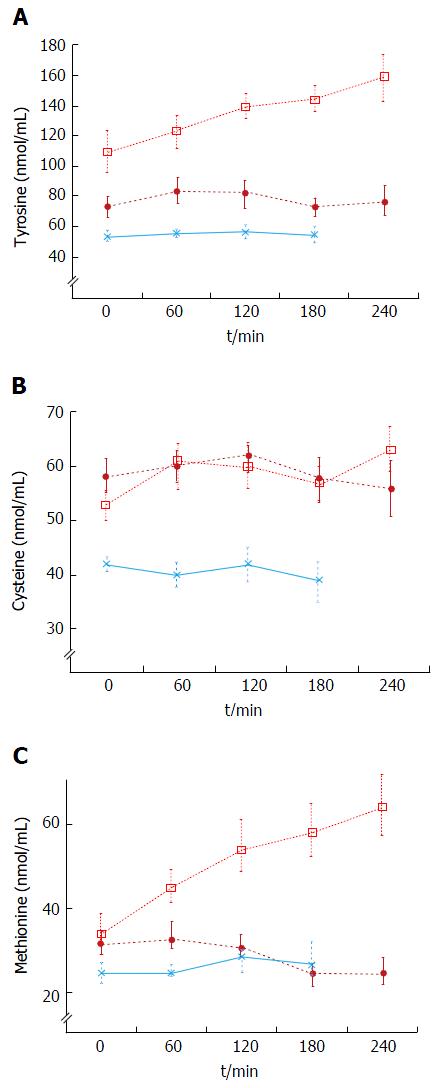
Figure 4 Plasma tyrosine (A), cysteine (B) and methionine (C) concentrations in response to protein meals.
Twenty grams protein meal, cirrhotics (n = 8), (closed circles); 20 g protein meal, healthy subjects (n = 6), (asterix) (mean ± SEM); 1 g/kg body weight protein meal, cirrhotics (n = 6), (open squares).
- Citation: Campollo O, Sprengers D, Dam G, Vilstrup H, McIntyre N. Protein tolerance to standard and high protein meals in patients with liver cirrhosis. World J Hepatol 2017; 9(14): 667-676
- URL: https://www.wjgnet.com/1948-5182/full/v9/i14/667.htm
- DOI: https://dx.doi.org/10.4254/wjh.v9.i14.667


