Copyright
©The Author(s) 2016.
World J Hepatol. Dec 28, 2016; 8(36): 1629-1636
Published online Dec 28, 2016. doi: 10.4254/wjh.v8.i36.1629
Published online Dec 28, 2016. doi: 10.4254/wjh.v8.i36.1629
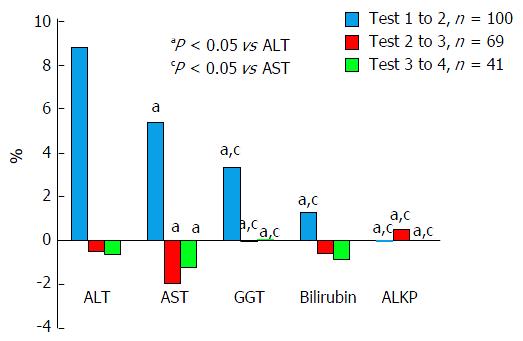
Figure 3 Comparison of relative percent changes (per hour) in bilirubin and liver enzymes, between serial tests.
Percent change per hour is shown for these five variables. a,cDenote significant statistical difference from ALT and AST respectively in the same time frame (i.e., ALT between test one and two compared with AST between test one and two). The number of cases in the analysis in the different time frames is shown on the top right. ALT: Alanine aminotransferase; AST: Aspartate aminotransferase; GGT: Gamma-glutamyl transferase; ALKP: Alkaline phosphatase.
- Citation: Resnick E, Shteingart S, Melamud B, Bdolah-Abram T, Zalut T, Reuben A, Lurie Y. Enzyme pattern of biliary colic: A counterintuitive picture. World J Hepatol 2016; 8(36): 1629-1636
- URL: https://www.wjgnet.com/1948-5182/full/v8/i36/1629.htm
- DOI: https://dx.doi.org/10.4254/wjh.v8.i36.1629


