Copyright
©The Author(s) 2016.
World J Hepatol. Dec 28, 2016; 8(36): 1610-1616
Published online Dec 28, 2016. doi: 10.4254/wjh.v8.i36.1610
Published online Dec 28, 2016. doi: 10.4254/wjh.v8.i36.1610
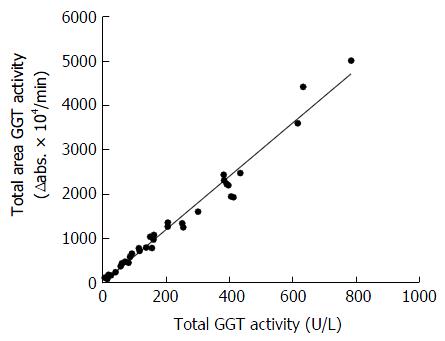
Figure 2 Linear correlation between the total area under the chromatograph curve multiplied by serum dilution factors and total serum gamma-glutamyltransferase activity.
Elution volume (between 12-38 mL). y = 5.9667x + 15.303; r = 0.988; P < 0.001; n = 49. GGT: Gamma-glutamyltransferase.
- Citation: Sueyoshi S, Sawai S, Satoh M, Seimiya M, Sogawa K, Fukumura A, Tsutsumi M, Nomura F. Fractionation of gamma-glutamyltransferase in patients with nonalcoholic fatty liver disease and alcoholic liver disease. World J Hepatol 2016; 8(36): 1610-1616
- URL: https://www.wjgnet.com/1948-5182/full/v8/i36/1610.htm
- DOI: https://dx.doi.org/10.4254/wjh.v8.i36.1610


