Copyright
©The Author(s) 2016.
World J Hepatol. Nov 28, 2016; 8(33): 1442-1451
Published online Nov 28, 2016. doi: 10.4254/wjh.v8.i33.1442
Published online Nov 28, 2016. doi: 10.4254/wjh.v8.i33.1442
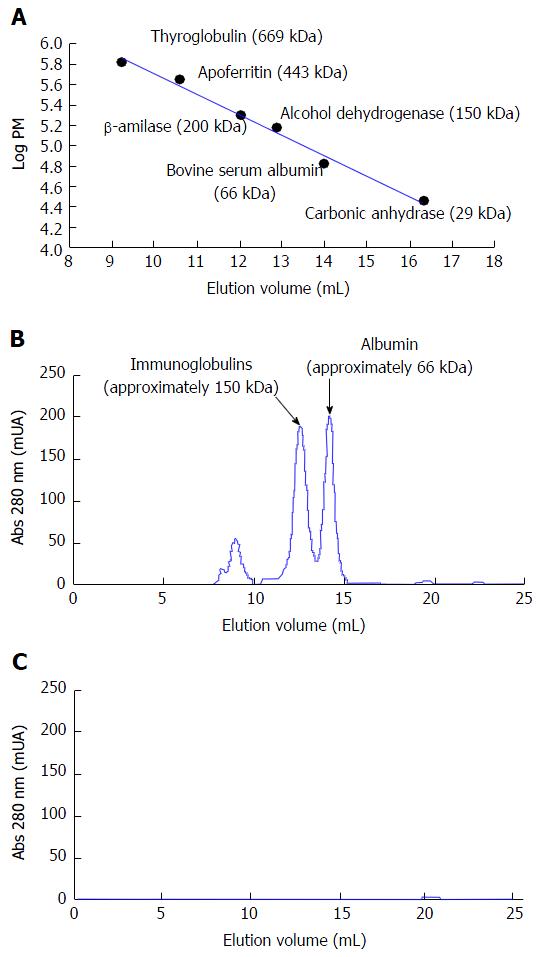
Figure 3 Protein analysis by gel filtration chromatography.
A: Calibration curve carried out with molecular weight markers; B: Chromatogram obtained for a sample of basal plasma; C: Chromatogram obtained for a sample of biological compartment, taken after 120 min of perfusion n = 5.
- Citation: Pizarro MD, Mediavilla MG, Quintana AB, Scandizzi ÁL, Rodriguez JV, Mamprin ME. Performance of cold-preserved rat liver Microorgans as the biological component of a simplified prototype model of bioartificial liver. World J Hepatol 2016; 8(33): 1442-1451
- URL: https://www.wjgnet.com/1948-5182/full/v8/i33/1442.htm
- DOI: https://dx.doi.org/10.4254/wjh.v8.i33.1442


