Copyright
©The Author(s) 2016.
World J Hepatol. Oct 18, 2016; 8(29): 1222-1233
Published online Oct 18, 2016. doi: 10.4254/wjh.v8.i29.1222
Published online Oct 18, 2016. doi: 10.4254/wjh.v8.i29.1222
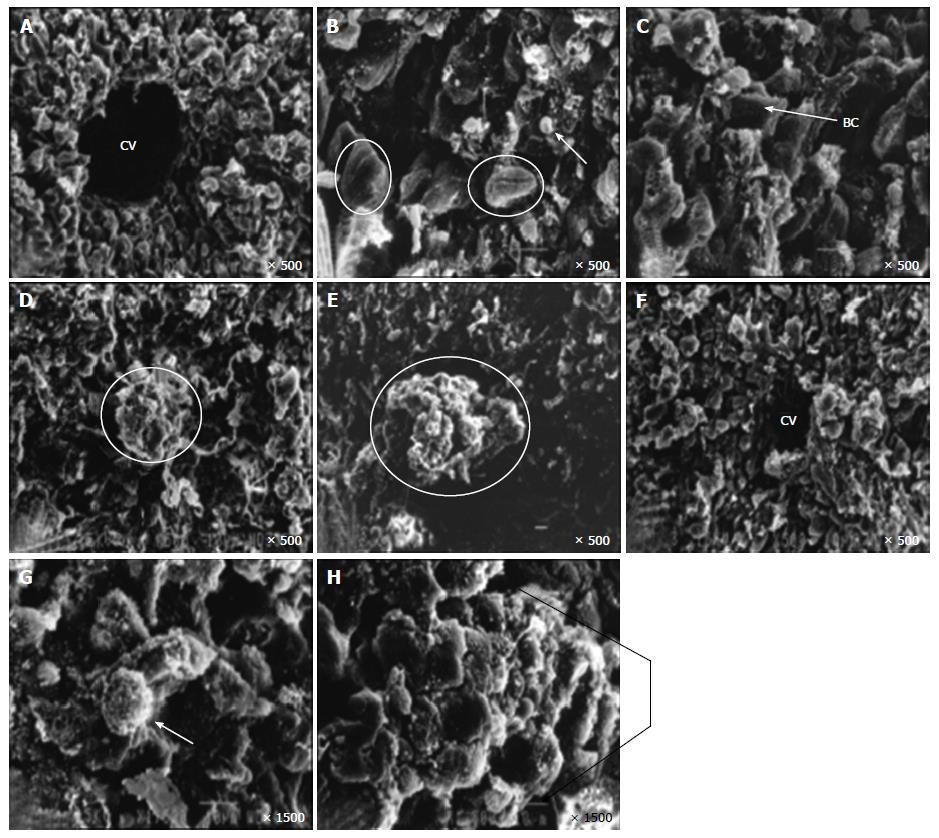
Figure 1 Scanning electron micrographs of liver tissue at × 500 and × 1500.
A and B: Control group, illustrating the central vein (CV), hexagonal hepatocytes (encircled) and biconcave RBCs in sinusoids (arrowed); C: LycT group illustrating hexagonal hepatocytes with bile canaliculi (BC) on theits surface (arrowed); D and E: NDEA group illustrating tumor nodules (encircled) with abnormal cell proliferation and disturbed ultrastructure; F-H: LycT + NDEA group respectively illustrating high cell density, CV, apoptotic bodies (arrowed) along with various alterations and two-three cell plate thickening indicating well-differentiated hepatocellular carcinoma, respectively. LycT: Lycopene extracted from tomatoes; NDEA: N-Nitrosodiethylamine; RBCs: Red blood cells.
- Citation: Gupta P, Bhatia N, Bansal MP, Koul A. Lycopene modulates cellular proliferation, glycolysis and hepatic ultrastructure during hepatocellular carcinoma. World J Hepatol 2016; 8(29): 1222-1233
- URL: https://www.wjgnet.com/1948-5182/full/v8/i29/1222.htm
- DOI: https://dx.doi.org/10.4254/wjh.v8.i29.1222


