Copyright
©The Author(s) 2016.
World J Hepatol. Sep 18, 2016; 8(26): 1110-1115
Published online Sep 18, 2016. doi: 10.4254/wjh.v8.i26.1110
Published online Sep 18, 2016. doi: 10.4254/wjh.v8.i26.1110
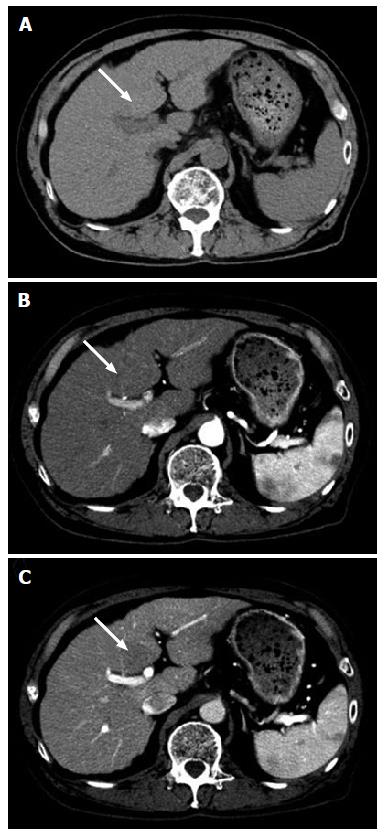
Figure 2 Computed tomography.
Plain computed tomography (CT) showed a hypodense tumor (A, arrow); Contrast-enhanced CT showed iso-enhancement in the arterial phase (B, arrow); and slightly hypo-enhancement in the portal phase (C, arrow).
- Citation: Kumagawa M, Matsumoto N, Watanabe Y, Hirayama M, Miura T, Nakagawara H, Ogawa M, Matsuoka S, Moriyama M, Takayama T, Sugitani M. Contrast-enhanced ultrasonographic findings of serum amyloid A-positive hepatocellular neoplasm: Does hepatocellular adenoma arise in cirrhotic liver? World J Hepatol 2016; 8(26): 1110-1115
- URL: https://www.wjgnet.com/1948-5182/full/v8/i26/1110.htm
- DOI: https://dx.doi.org/10.4254/wjh.v8.i26.1110


