Copyright
©The Author(s) 2016.
World J Hepatol. Jun 8, 2016; 8(16): 673-684
Published online Jun 8, 2016. doi: 10.4254/wjh.v8.i16.673
Published online Jun 8, 2016. doi: 10.4254/wjh.v8.i16.673
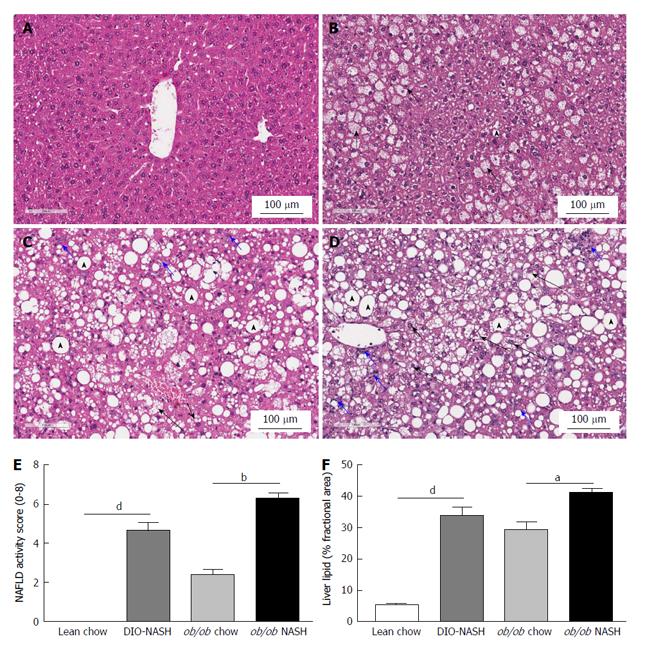
Figure 4 Histological assessment of non-alcoholic fatty liver disease activity score and liver lipid at study end.
Representative H and E stained sections from; lean chow (A), ob/ob chow (B), DIO-NASH (C) and ob/ob NASH (D) mouse models. NAFLD activity score (steatosis, inflammation and ballooning degeneration) performed by a blinded pathologist at study end (E), and quantitatively image analysis of steatosis (% area) from H and E staining using visiomorph software (F). Macrovesicular steatosis indicated by arrowheads, microvesicular steatosis indicated by short black arrows, inflammation indicated by short blue arrows, ballooning degeneration indicated by long black arrows. aP < 0.05, bP < 0.01, dP < 0.001. The results are presented as mean ± SEM. Lean chow (n = 9), DIO-NASH (n = 12), ob/ob chow (n = 8), ob/ob NASH (n = 10). NASH: Nonalcoholic steatohepatitis; NAFLD: Nonalcoholic fatty liver disease; SEM: Standard error of the mean.
- Citation: Kristiansen MNB, Veidal SS, Rigbolt KTG, Tølbøl KS, Roth JD, Jelsing J, Vrang N, Feigh M. Obese diet-induced mouse models of nonalcoholic steatohepatitis-tracking disease by liver biopsy. World J Hepatol 2016; 8(16): 673-684
- URL: https://www.wjgnet.com/1948-5182/full/v8/i16/673.htm
- DOI: https://dx.doi.org/10.4254/wjh.v8.i16.673


