Copyright
©The Author(s) 2016.
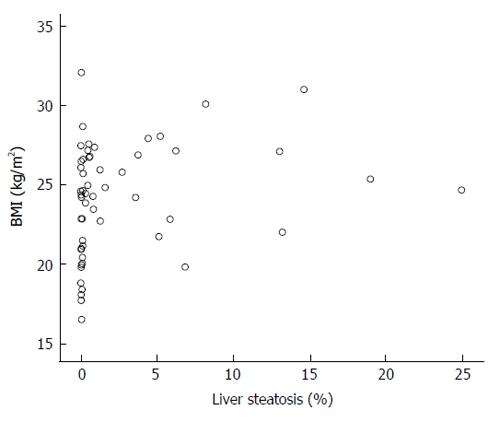
Figure 3 Scattergram showing the relation of body mass index with the amount of liver steatosis.
Despite a significant relationship between both variables (ρ = 0.41; P = 0.002), as shown, some patients with BMI over 30 show no steatosis at all or only minimal amount of liver fat, in contrast with some others with BMI below 25 and marked steatosis in their livers. BMI: Body mass index.
- Citation: González-Reimers E, López-Prieto J, Quintero-Platt G, Pelazas-González R, Alemán-Valls MR, Pérez-Hernández O, de-la-Vega-Prieto MJ, Gómez-Rodríguez MA, Martín-González C, Santolaria-Fernández F. Adipokines, cytokines and body fat stores in hepatitis C virus liver steatosis. World J Hepatol 2016; 8(1): 74-82
- URL: https://www.wjgnet.com/1948-5182/full/v8/i1/74.htm
- DOI: https://dx.doi.org/10.4254/wjh.v8.i1.74


