Copyright
©The Author(s) 2015.
World J Hepatol. May 18, 2015; 7(8): 1041-1053
Published online May 18, 2015. doi: 10.4254/wjh.v7.i8.1041
Published online May 18, 2015. doi: 10.4254/wjh.v7.i8.1041
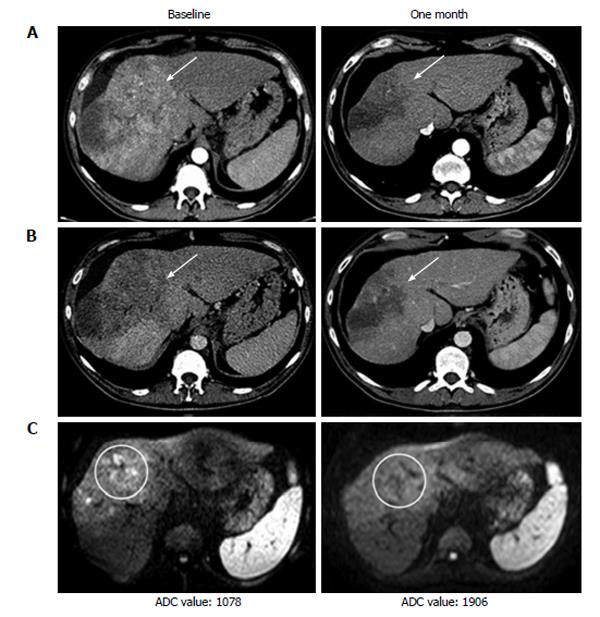
Figure 3 Computed tomography and magnetic resonance imaging examination at baseline and one month after the start of sorafenib therapy of a patient showing partial response.
A: Arterial phase computed tomography (CT); B: Venous phase CT; C: Magnetic resonance imaging diffusion weighted imaging. ADC: Apparent diffusion coefficient.
- Citation: Colagrande S, Regini F, Taliani GG, Nardi C, Inghilesi AL. Advanced hepatocellular carcinoma and sorafenib: Diagnosis, indications, clinical and radiological follow-up. World J Hepatol 2015; 7(8): 1041-1053
- URL: https://www.wjgnet.com/1948-5182/full/v7/i8/1041.htm
- DOI: https://dx.doi.org/10.4254/wjh.v7.i8.1041


