Copyright
©The Author(s) 2015.
World J Hepatol. Apr 18, 2015; 7(5): 769-776
Published online Apr 18, 2015. doi: 10.4254/wjh.v7.i5.769
Published online Apr 18, 2015. doi: 10.4254/wjh.v7.i5.769
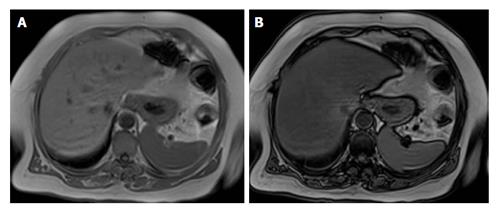
Figure 3 Magnetic resonance imaging evaluation of fatty liver using chemical shift imaging.
A: In-phase image; B: Out-of-phase image. When out-of-phase image is compared with in-phase images, it shows the signal intensity decrease.
- Citation: Koplay M, Sivri M, Erdogan H, Nayman A. Importance of imaging and recent developments in diagnosis of nonalcoholic fatty liver disease. World J Hepatol 2015; 7(5): 769-776
- URL: https://www.wjgnet.com/1948-5182/full/v7/i5/769.htm
- DOI: https://dx.doi.org/10.4254/wjh.v7.i5.769


