Copyright
©The Author(s) 2015.
World J Hepatol. Nov 28, 2015; 7(27): 2749-2756
Published online Nov 28, 2015. doi: 10.4254/wjh.v7.i27.2749
Published online Nov 28, 2015. doi: 10.4254/wjh.v7.i27.2749
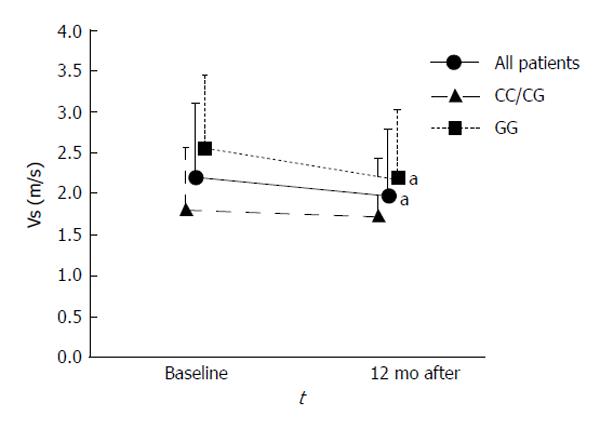
Figure 4 Evolution of velocity of shear wave during the study period.
aIndicate a difference compared with baseline values (P < 0.05). Velocity of shear wave (Vs) in all patients decreased from baseline to 12 mo (P = 0.005). Vs in the GG group also decreased from baseline to 12 mo (P = 0.029), and that in the CC/CG group also tended to decrease (P = 0.083).
- Citation: Fukui A, Kawabe N, Hashimoto S, Murao M, Nakano T, Shimazaki H, Kan T, Nakaoka K, Ohki M, Takagawa Y, Takamura T, Kamei H, Yoshioka K. Vitamin E reduces liver stiffness in nonalcoholic fatty liver disease. World J Hepatol 2015; 7(27): 2749-2756
- URL: https://www.wjgnet.com/1948-5182/full/v7/i27/2749.htm
- DOI: https://dx.doi.org/10.4254/wjh.v7.i27.2749


