Copyright
©The Author(s) 2015.
World J Hepatol. Nov 28, 2015; 7(27): 2749-2756
Published online Nov 28, 2015. doi: 10.4254/wjh.v7.i27.2749
Published online Nov 28, 2015. doi: 10.4254/wjh.v7.i27.2749
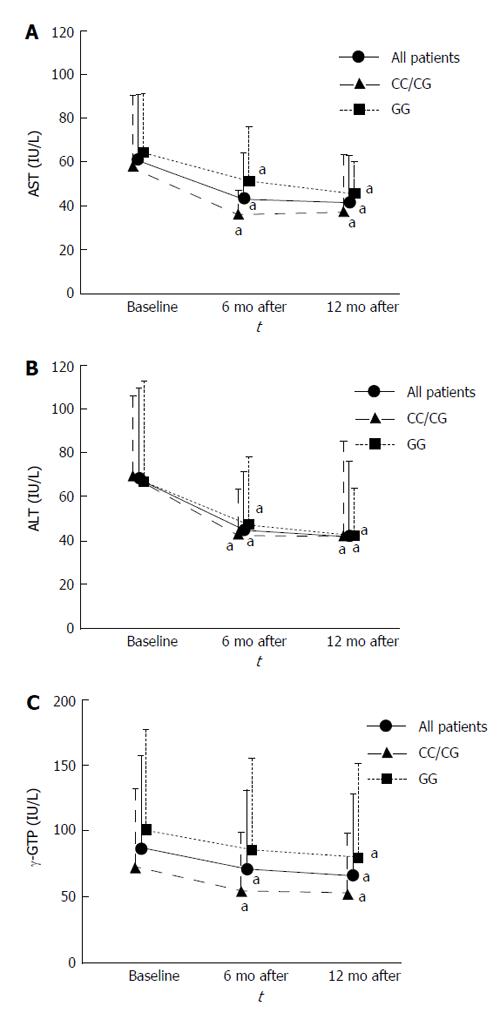
Figure 2 Effects of vitamin E treatment on liver enzyme levels.
aIndicate a difference when the results are compared with baseline values (P < 0.05). A: Evolution of AST during the study period. Serum AST levels in all patients decreased from baseline to 6 and 12 mo (P < 0.001 and P < 0.001, respectively). Serum AST levels in the CC/CG group decreased from baseline to 6 and 12 mo (P = 0.004 and P < 0.001, respectively). Serum AST levels in the GG group also decreased from baseline to 6 and 12 mo (P = 0.045 and P = 0.011, respectively); B: Evolution of ALT during the study period. Serum ALT levels in all patients decreased from baseline to 6 and 12 mo (P < 0.001 and P < 0.001, respectively). Serum ALT levels in the CC/CG group decreased from baseline to 6 and 12 mo (P = 0.022 and P < 0.001, respectively). Serum ALT levels in the GG group also decreased from baseline to 6 and 12 mo (P = 0.004 and P < 0.001, respectively); C: Evolution of γ-GTP during the study period. Serum γ-GTP levels in all patients decreased from baseline to 6 and 12 mo (P = 0.019 and P < 0.001, respectively). Serum γ-GTP levels in the CC/CG group decreased from baseline to 6 and 12 mo (P = 0.047 and P = 0.003, respectively). Those in the GG group decreased from baseline to 12 mo (P = 0.005). AST: Aspartate aminotransferase; ALT: Alanine aminotranferease; γ-GTP: γ-glutamyl transpeptidase.
- Citation: Fukui A, Kawabe N, Hashimoto S, Murao M, Nakano T, Shimazaki H, Kan T, Nakaoka K, Ohki M, Takagawa Y, Takamura T, Kamei H, Yoshioka K. Vitamin E reduces liver stiffness in nonalcoholic fatty liver disease. World J Hepatol 2015; 7(27): 2749-2756
- URL: https://www.wjgnet.com/1948-5182/full/v7/i27/2749.htm
- DOI: https://dx.doi.org/10.4254/wjh.v7.i27.2749


