Copyright
©The Author(s) 2015.
World J Hepatol. Nov 18, 2015; 7(26): 2696-2702
Published online Nov 18, 2015. doi: 10.4254/wjh.v7.i26.2696
Published online Nov 18, 2015. doi: 10.4254/wjh.v7.i26.2696
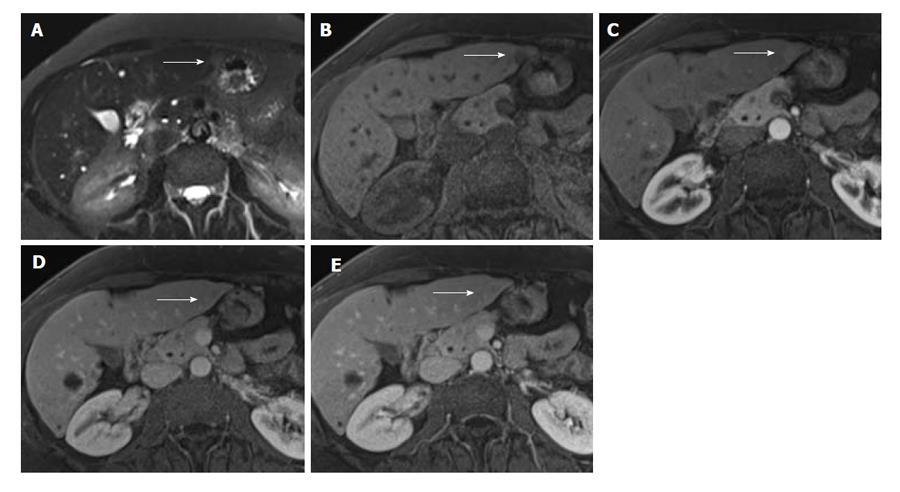
Figure 3 Imaging findings of case 2.
A: T2-weighted fat-saturated image showing subtle focal mass (indicated by arrow) in subcapsular portion of segment 2 with increased signal intensity as compared to background liver; B: T1-weighted fat-saturated image showing small focal mass with decreased signal intensity as compared to background liver; C: T1-weighted fat-saturated image after contrast infusion in the late arterial phase. The mass shows subtle hypervascular enhancement on this phase; D: T1-weighted fat-saturated image after contrast infusion in the portal venous phase. The mass shows faint wash-out on this phase; E: T1-weighted fat-saturated image after contrast infusion in 3 min delayed post contrast phase. The mass shows faint filling in.
- Citation: Kwon YK, Jha RC, Etesami K, Fishbein TM, Ozdemirli M, Desai CS. Pseudolymphoma (reactive lymphoid hyperplasia) of the liver: A clinical challenge. World J Hepatol 2015; 7(26): 2696-2702
- URL: https://www.wjgnet.com/1948-5182/full/v7/i26/2696.htm
- DOI: https://dx.doi.org/10.4254/wjh.v7.i26.2696


