Copyright
©The Author(s) 2015.
World J Hepatol. Nov 18, 2015; 7(26): 2664-2675
Published online Nov 18, 2015. doi: 10.4254/wjh.v7.i26.2664
Published online Nov 18, 2015. doi: 10.4254/wjh.v7.i26.2664
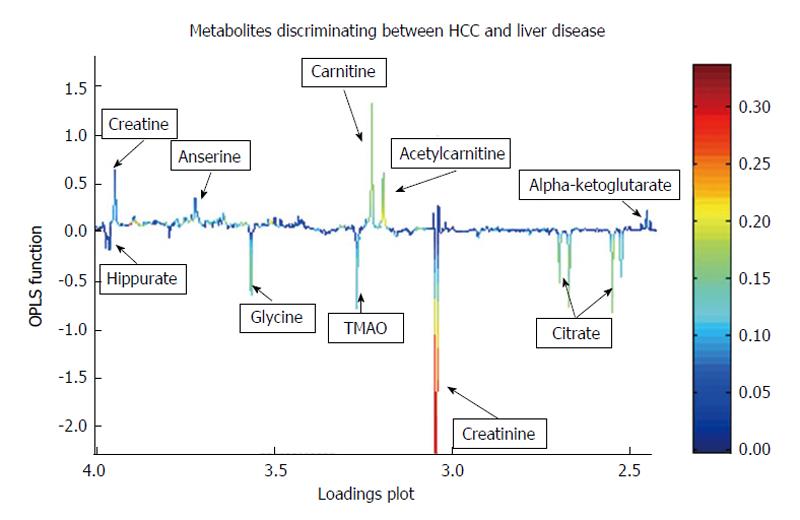
Figure 6 Statistical “loadings plot” of information obtained from an urinary nuclear magnetic resonance spectroscopy data set showing metabolites upregulated in hepatocellular carcinoma (upward peaks: Carnitine, anserine, creatine, acetylcarnitine, alpha-ketoglutarate) and downregulated in hepatocellular carcinoma (downward pointing peaks: Hippurate, glycine, trimethylamineoxide, creatinine, citrate), compared to urinary nuclear magnetic resonance spectroscopy data from patients with cirrhosis.
Most metabolites represent alternative energy metabolites as liver tumours are not solely dependent on glycolysis for an energy source. HCC: Hepatocellular carcinoma; TMA: Trimethylamineoxide; OPLS: Orthogonal partial least squares discriminant analysis.
- Citation: Trovato FM, Tognarelli JM, Crossey MM, Catalano D, Taylor-Robinson SD, Trovato GM. Challenges of liver cancer: Future emerging tools in imaging and urinary biomarkers. World J Hepatol 2015; 7(26): 2664-2675
- URL: https://www.wjgnet.com/1948-5182/full/v7/i26/2664.htm
- DOI: https://dx.doi.org/10.4254/wjh.v7.i26.2664


