Copyright
©The Author(s) 2015.
World J Hepatol. Aug 18, 2015; 7(17): 2119-2126
Published online Aug 18, 2015. doi: 10.4254/wjh.v7.i17.2119
Published online Aug 18, 2015. doi: 10.4254/wjh.v7.i17.2119
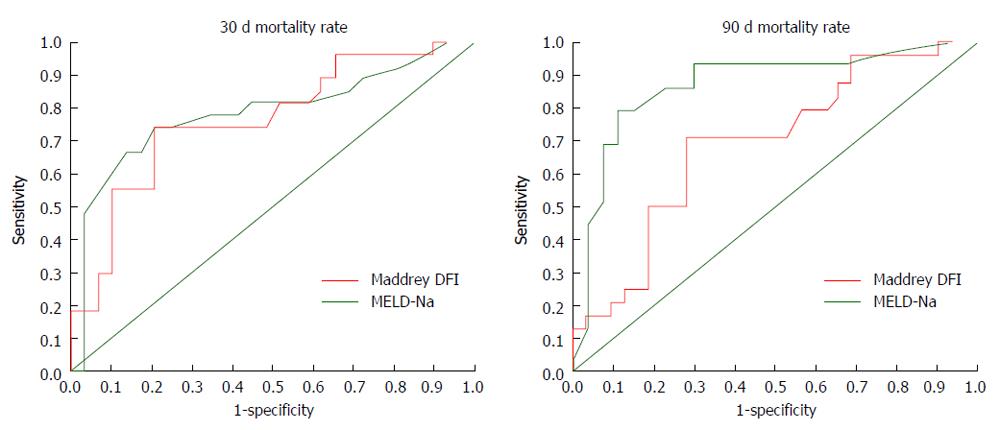
Figure 1 Comparison of Maddrey discrimination function index and model for end-stage liver disease-Na in predicting mortality at 30 and 90 d in alcoholic hepatitis.
For 30-d mortality the area under the curve (AUC) was 0.763 for Maddrey DFI and 0.784 for MELD-Na (P = 0.82). For 90-d mortality the AUC was 0.685 for Maddrey DFI and 0.8710 for MELD-Na (P = 0.041). MELD: Model for end-stage liver disease; DFI: Discrimination function index.
- Citation: Amieva-Balmori M, Mejia-Loza SMI, Ramos-González R, Zamarripa-Dorsey F, García-Ruiz E, Pérez y López N, Juárez-Valdés EI, López-Luria A, Remes-Troche JM. Model for end-stage liver disease-Na score or Maddrey discrimination function index, which score is best? World J Hepatol 2015; 7(17): 2119-2126
- URL: https://www.wjgnet.com/1948-5182/full/v7/i17/2119.htm
- DOI: https://dx.doi.org/10.4254/wjh.v7.i17.2119


