Copyright
©The Author(s) 2015.
World J Hepatol. Aug 18, 2015; 7(17): 2069-2079
Published online Aug 18, 2015. doi: 10.4254/wjh.v7.i17.2069
Published online Aug 18, 2015. doi: 10.4254/wjh.v7.i17.2069
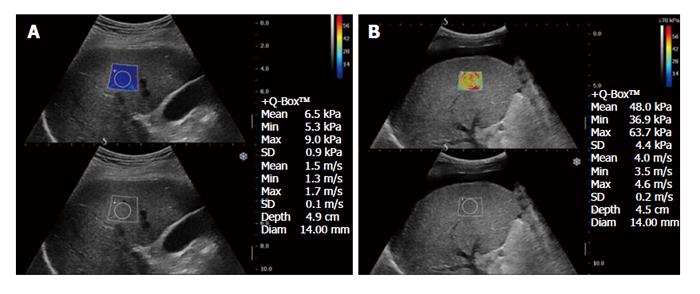
Figure 5 The region of interest of supersonic shear wave imaging is positioned in the right lobe of the liver, with an intercostals scan.
On the right of the display there is shear wave velocity (expressed in kPa and m/s). The display show a real-time color mapping of the elasticity encoded pixel by pixel in an image superimposed on the standard B-mode. In panel (A) subject with normal shear wave speed value. In panel (B) patient with shear wave speed value compatible with liver cirrhosis. The display also shows large amount of ascites.
- Citation: Yeom SK, Lee CH, Cha SH, Park CM. Prediction of liver cirrhosis, using diagnostic imaging tools. World J Hepatol 2015; 7(17): 2069-2079
- URL: https://www.wjgnet.com/1948-5182/full/v7/i17/2069.htm
- DOI: https://dx.doi.org/10.4254/wjh.v7.i17.2069


