Copyright
©The Author(s) 2015.
World J Hepatol. Aug 18, 2015; 7(17): 2069-2079
Published online Aug 18, 2015. doi: 10.4254/wjh.v7.i17.2069
Published online Aug 18, 2015. doi: 10.4254/wjh.v7.i17.2069
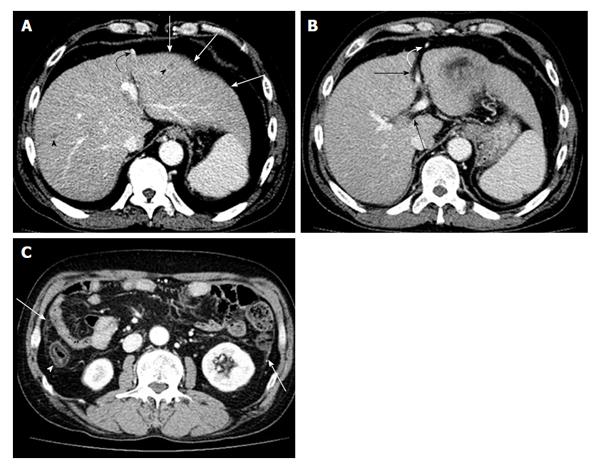
Figure 1 Contrast enhanced computed tomography portal phase images of the patient with liver cirrhosis due to chronic hepatitis B.
A: Liver shows surface undulation (arrows). Two small low attenuated nodules are seen in both hepatic lobes suggesting regenerative nodules (arrow heads). Recanalized paraumbilical vein and paraesophageal varix are noted (curved arrow); B: Recanalization of paraumbilical vein (curved arrow) represents portal hypertension. Widening of hepatic fissure and porta hepatis is seen (black arrows); C: Ascending colon presents edematous wall thickening caused by congestion due to portal hypertension or hypoalbuminemic edema (curved arrow). Diffuse peritoneal thickening is also noted (arrows).
- Citation: Yeom SK, Lee CH, Cha SH, Park CM. Prediction of liver cirrhosis, using diagnostic imaging tools. World J Hepatol 2015; 7(17): 2069-2079
- URL: https://www.wjgnet.com/1948-5182/full/v7/i17/2069.htm
- DOI: https://dx.doi.org/10.4254/wjh.v7.i17.2069


