Copyright
©The Author(s) 2015.
World J Hepatol. Jun 8, 2015; 7(10): 1403-1411
Published online Jun 8, 2015. doi: 10.4254/wjh.v7.i10.1403
Published online Jun 8, 2015. doi: 10.4254/wjh.v7.i10.1403
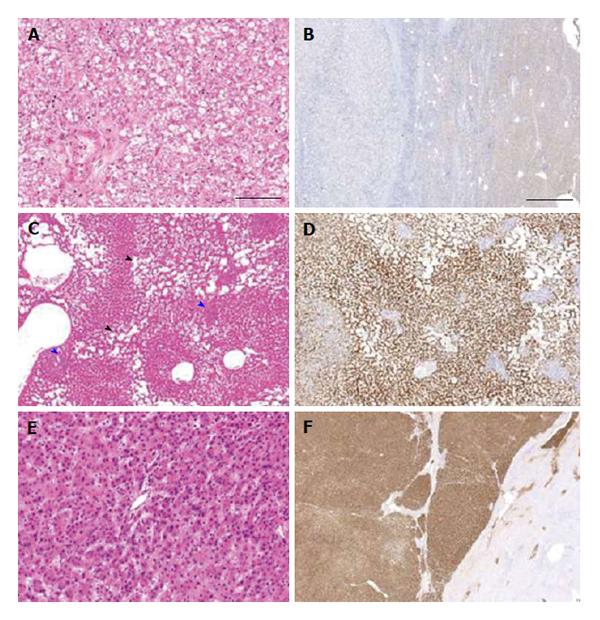
Figure 2 Hepatocellular adenoma.
A and B: HNF1α-inactivated hepatocellular adenoma (HCA) with marked steatosis [A, hematoxylin and eosin (HE) stain, × 20] and loss of liver fatty acid binding protein (LFABP) expression by immunohistochemistry (left) in comparison to non-neoplastic liver (right) [B, anti-LFABP/3,3’-diaminobenzidine (DAB), × 1]; C and D: Inflammatory HCA with dilated sinusoids (telangiectasia, black arrowheads) and patchy inflammation (blue arrowheads) (C, HE stain, × 5) and diffuse serum amyloid A staining by immunohistochemistry (D, anti-serum amyloid A/DAB, × 5); E and F: β-catenin-activated HCA with strong diffuse staining for glutamine synthetase (upper left), in comparison to centrilobular staining of normal liver (lower right) (E, HE stain, × 20; F, anti-glutamine synthetase/DAB, × 1).
- Citation: Koehne de Gonzalez AK, Salomao MA, Lagana SM. Current concepts in the immunohistochemical evaluation of liver tumors. World J Hepatol 2015; 7(10): 1403-1411
- URL: https://www.wjgnet.com/1948-5182/full/v7/i10/1403.htm
- DOI: https://dx.doi.org/10.4254/wjh.v7.i10.1403


