Copyright
©2014 Baishideng Publishing Group Inc.
World J Hepatol. Aug 27, 2014; 6(8): 613-620
Published online Aug 27, 2014. doi: 10.4254/wjh.v6.i8.613
Published online Aug 27, 2014. doi: 10.4254/wjh.v6.i8.613
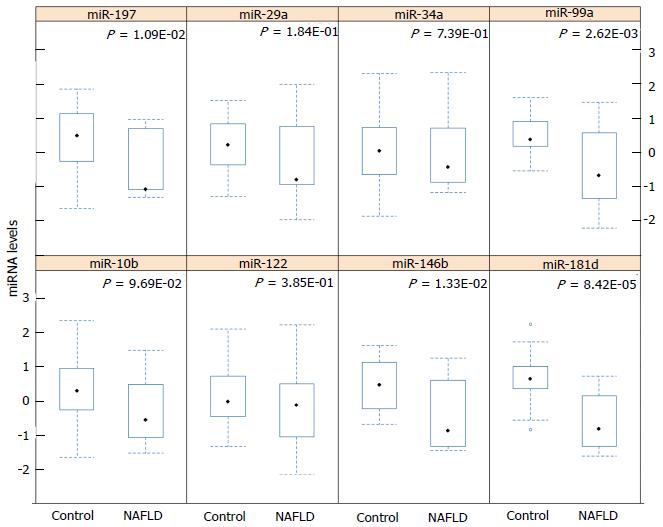
Figure 1 Box plots showing the expression value of 8 genes between control and non-alcoholic fatty liver disease groups.
The middle line indicates the median statistic, the bottom and top of the box show the 25th and 75th percentiles, the lower and upper whiskers show the minimum and maximum values of the data after detecting outliers (circles). P values were obtained from a two-sided t test and adjusted with false discovery rate. NAFLD: Non-alcoholic fatty liver disease.
- Citation: Celikbilek M, Baskol M, Taheri S, Deniz K, Dogan S, Zararsiz G, Gursoy S, Guven K, Ozbakır O, Dundar M, Yucesoy M. Circulating microRNAs in patients with non-alcoholic fatty liver disease. World J Hepatol 2014; 6(8): 613-620
- URL: https://www.wjgnet.com/1948-5182/full/v6/i8/613.htm
- DOI: https://dx.doi.org/10.4254/wjh.v6.i8.613


