Copyright
©2014 Baishideng Publishing Group Inc.
World J Hepatol. Jul 27, 2014; 6(7): 496-503
Published online Jul 27, 2014. doi: 10.4254/wjh.v6.i7.496
Published online Jul 27, 2014. doi: 10.4254/wjh.v6.i7.496
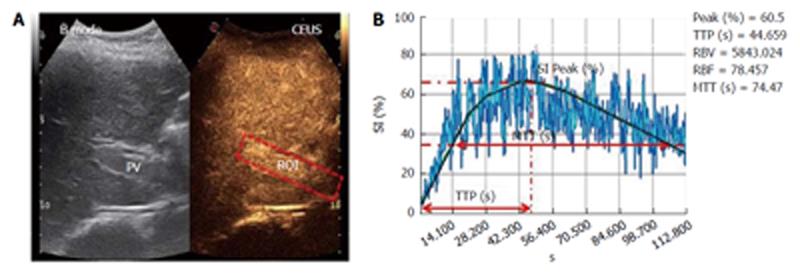
Figure 2 Example of region of interest selection in the portal vein and Qontrast®-assisted contrast-enhanced ultrasound analysis of portal vein parameters in healthy control.
A: Region of interest (ROI) drawn in a region of the portal vein (PV) in a selected set of higher signal intensity frames 1 min and 10 s after SonoVue® injection; B: A gamma variate (bolus)-corrected parametric curve for the translational movement caused by breathing activity. SI (%): Signal intensity; PEAK (%): Maximum signal intensity reached during SonoVue® bolus injection; TTP (s): Time to peak; RBV (cm3): Regional blood volume; RBF (cm3/s): Regional blood flow; MTT (s): Mean transit time.
- Citation: Cocciolillo S, Parruti G, Marzio L. CEUS and Fibroscan in non-alcoholic fatty liver disease and non-alcoholic steatohepatitis. World J Hepatol 2014; 6(7): 496-503
- URL: https://www.wjgnet.com/1948-5182/full/v6/i7/496.htm
- DOI: https://dx.doi.org/10.4254/wjh.v6.i7.496


