Copyright
©2014 Baishideng Publishing Group Co.
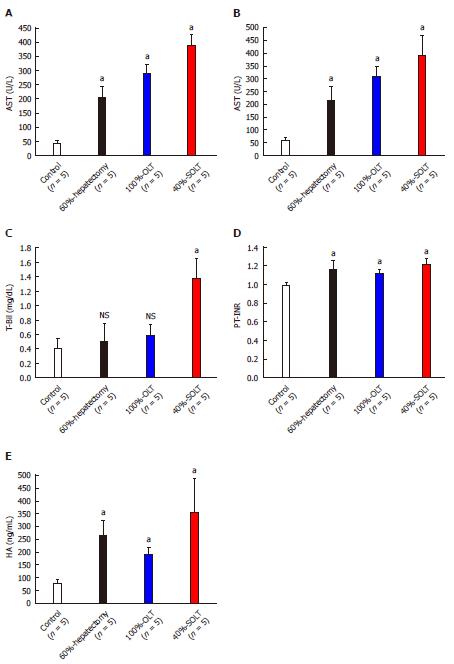
Figure 3 Biochemical and coagulation profiles.
A: Serum aspartate aminotransferase (AST); B: Serum alanine aminotransferase (ALT); C: Serum total bilirubin (T-Bil); D: Plasma international normalized ratio of prothrombin time (PT-INR); E: Serum hyaluronic acid (HA). aP < 0.05 vs control. NS: Not significant (P≥ 0.05); OLT: Orthotopic liver transplantation; SOLT: Split orthotopic liver transplantation.
- Citation: Hori T, Uemoto S, Chen F, Gardner LB, Baine AMT, Hata T, Kogure T, Nguyen JH. Oxidative stress and extracellular matrices after hepatectomy and liver transplantation in rats. World J Hepatol 2014; 6(2): 72-84
- URL: https://www.wjgnet.com/1948-5182/full/v6/i2/72.htm
- DOI: https://dx.doi.org/10.4254/wjh.v6.i2.72


