Copyright
©2014 Baishideng Publishing Group Inc.
World J Hepatol. Oct 27, 2014; 6(10): 752-758
Published online Oct 27, 2014. doi: 10.4254/wjh.v6.i10.752
Published online Oct 27, 2014. doi: 10.4254/wjh.v6.i10.752
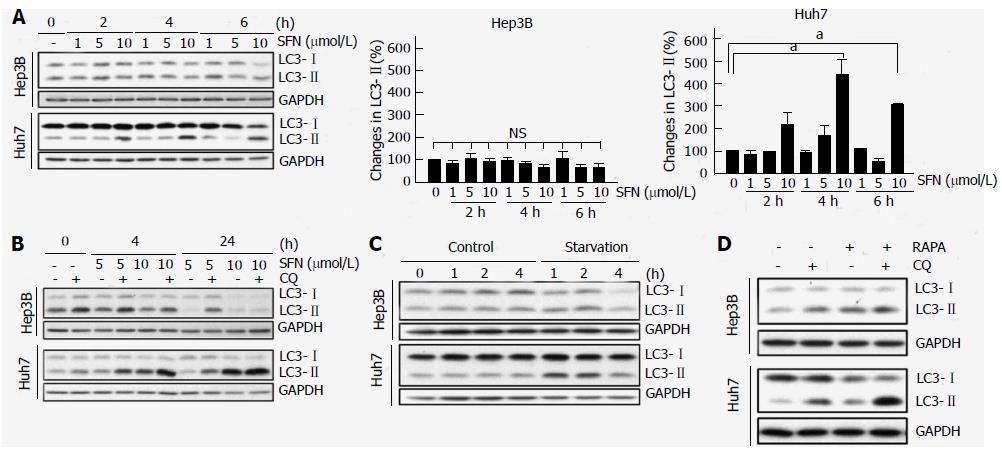
Figure 2 Autophagic response to sorafenib.
A: LC3 expression in hepatocellular carcinoma cells was analyzed in the presence of SFN for up to 6 h. Representative blot (left panel) and quantitative analysis of LC3-II by densitometry (middle and right panel). aP < 0.05; B: LC3 expression was analyzed in the presence of SFN with and without CQ to determine autophagy flux after 4 and 24 h; C: Autophagic response to nutrient-rich (control) or nutrient-depleted medium was analyzed by immunoblotting of LC3 in Hep3B and Huh7 cells for up to 4 h; D: LC3 expression was analyzed in the presence of 5 nmol/L RAPA after 4 h treatment with and without CQ to examine autophagy flux. NS: Non-significant; SFN: Sorafenib; CQ: Chloroquine; RAPA: Rapamycin.
- Citation: Fischer TD, Wang JH, Vlada A, Kim JS, Behrns KE. Role of autophagy in differential sensitivity of hepatocarcinoma cells to sorafenib. World J Hepatol 2014; 6(10): 752-758
- URL: https://www.wjgnet.com/1948-5182/full/v6/i10/752.htm
- DOI: https://dx.doi.org/10.4254/wjh.v6.i10.752


