Copyright
©2013 Baishideng Publishing Group Co.
World J Hepatol. Sep 27, 2013; 5(9): 513-520
Published online Sep 27, 2013. doi: 10.4254/wjh.v5.i9.513
Published online Sep 27, 2013. doi: 10.4254/wjh.v5.i9.513
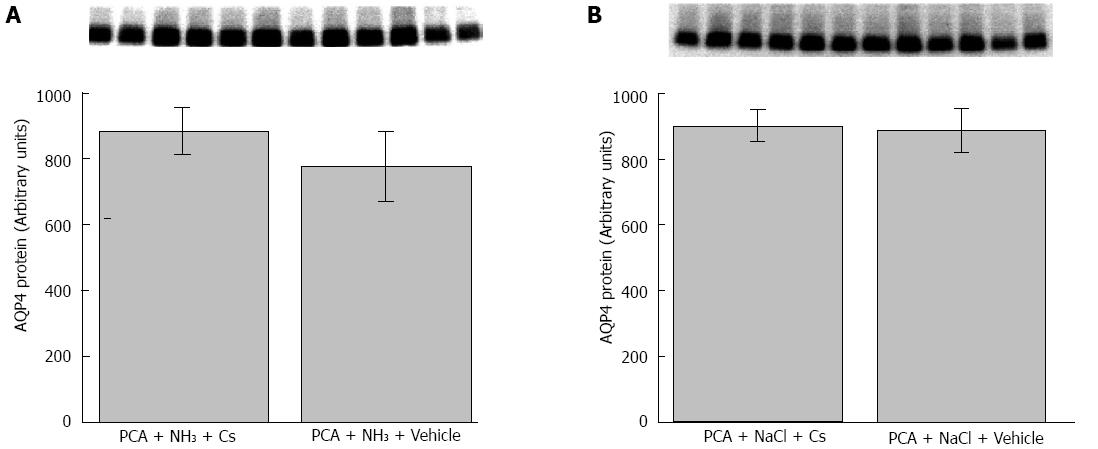
Figure 3 Brain aquaporin-4 expression.
A: Bar plot and Western blot of AQP4 content of cerebral cortex in group 1 (six leftmost bands) and group 2 (six rightmost bands). No statistical significant difference was found between groups (unpaired student’s t test on densitometric values); B: Bar plot and Western blot of AQP4 content of cerebral cortex in group 3 (six leftmost bands) and group 4 (six rightmost bands). No statistical significant difference was found between groups (unpaired student’s t test on densitometric values). AQP: Aquaporin; PCA: Portacaval anastomosis; Cs: Ciclosporin.
- Citation: Larsen RH, Kjær MS, Eefsen M, Larsen FS, Bjerring PN. Ciclosporin does not attenuate intracranial hypertension in rats with acute hyperammonaemia. World J Hepatol 2013; 5(9): 513-520
- URL: https://www.wjgnet.com/1948-5182/full/v5/i9/513.htm
- DOI: https://dx.doi.org/10.4254/wjh.v5.i9.513


