Copyright
©2013 Baishideng Publishing Group Co.
World J Hepatol. Apr 27, 2013; 5(4): 160-169
Published online Apr 27, 2013. doi: 10.4254/wjh.v5.i4.160
Published online Apr 27, 2013. doi: 10.4254/wjh.v5.i4.160
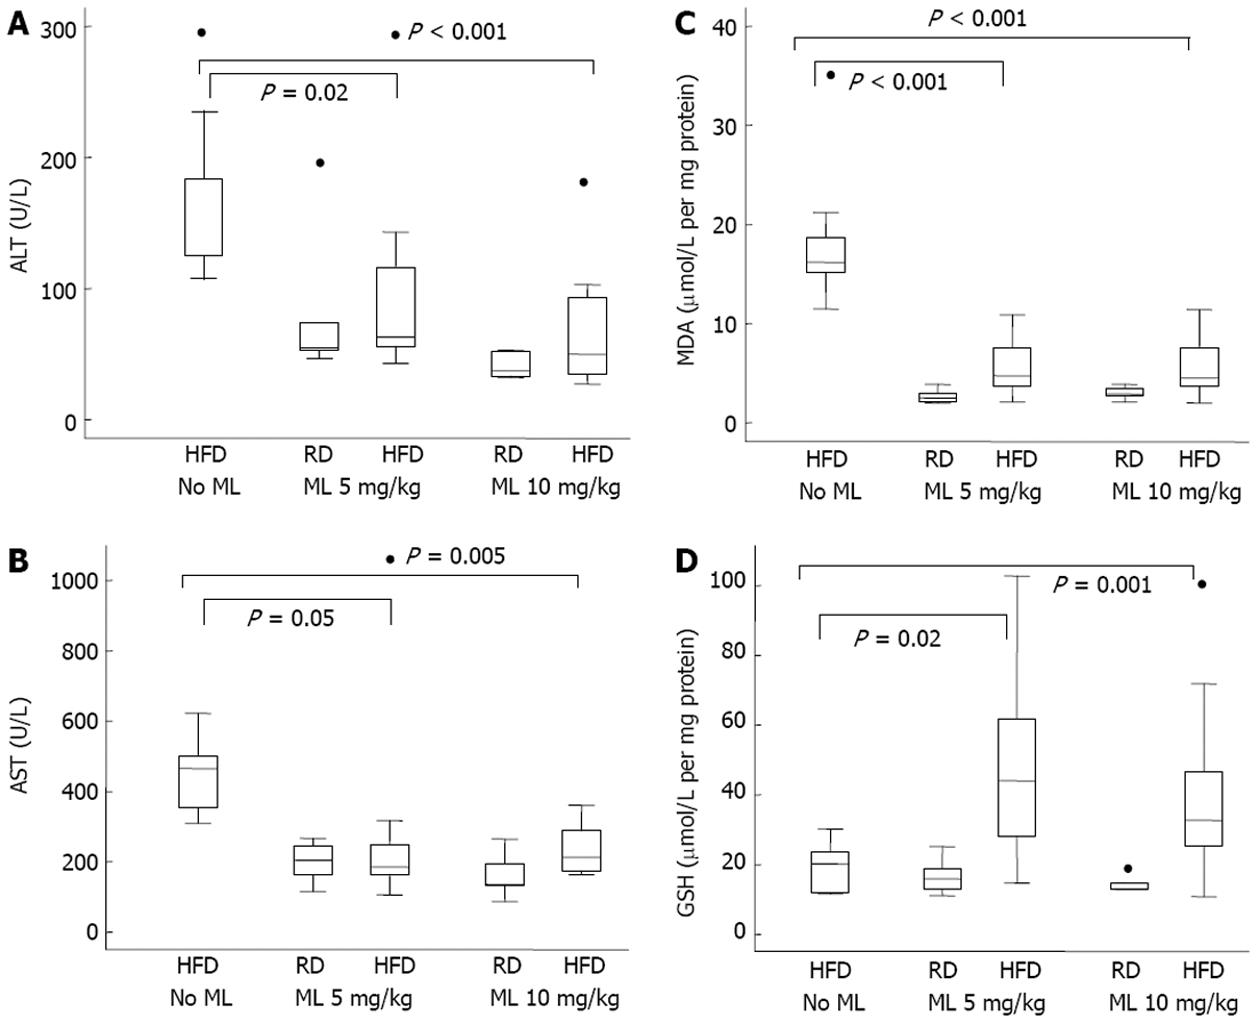
Figure 3 Hepatic inflammation and oxidative stress assessment.
A: Hepatic inflammation represented by serum alanine aminotransferase; B: Aspartate aminotransferase; C: Oxidative stress represented by tissue levels of malondialdehyde; D: Glutathione, in rats on regular or high fat diet, with or without melatonin. ALT: Alanine aminotransferase; AST: Aspartate aminotransferase; MDA: Malondialdehyde; GSH: Glutathione; HFD: High fat diet; RD: Regular diet; ML: Melatonin; ●: Indicates outliers.
- Citation: Hatzis G, Ziakas P, Kavantzas N, Triantafyllou A, Sigalas P, Andreadou I, Ioannidis K, Chatzis S, Filis K, Papalampros A, Sigala F. Melatonin attenuates high fat diet-induced fatty liver disease in rats. World J Hepatol 2013; 5(4): 160-169
- URL: https://www.wjgnet.com/1948-5182/full/v5/i4/160.htm
- DOI: https://dx.doi.org/10.4254/wjh.v5.i4.160


