Copyright
©2013 Baishideng Publishing Group Co.
World J Hepatol. Oct 27, 2013; 5(10): 558-567
Published online Oct 27, 2013. doi: 10.4254/wjh.v5.i10.558
Published online Oct 27, 2013. doi: 10.4254/wjh.v5.i10.558
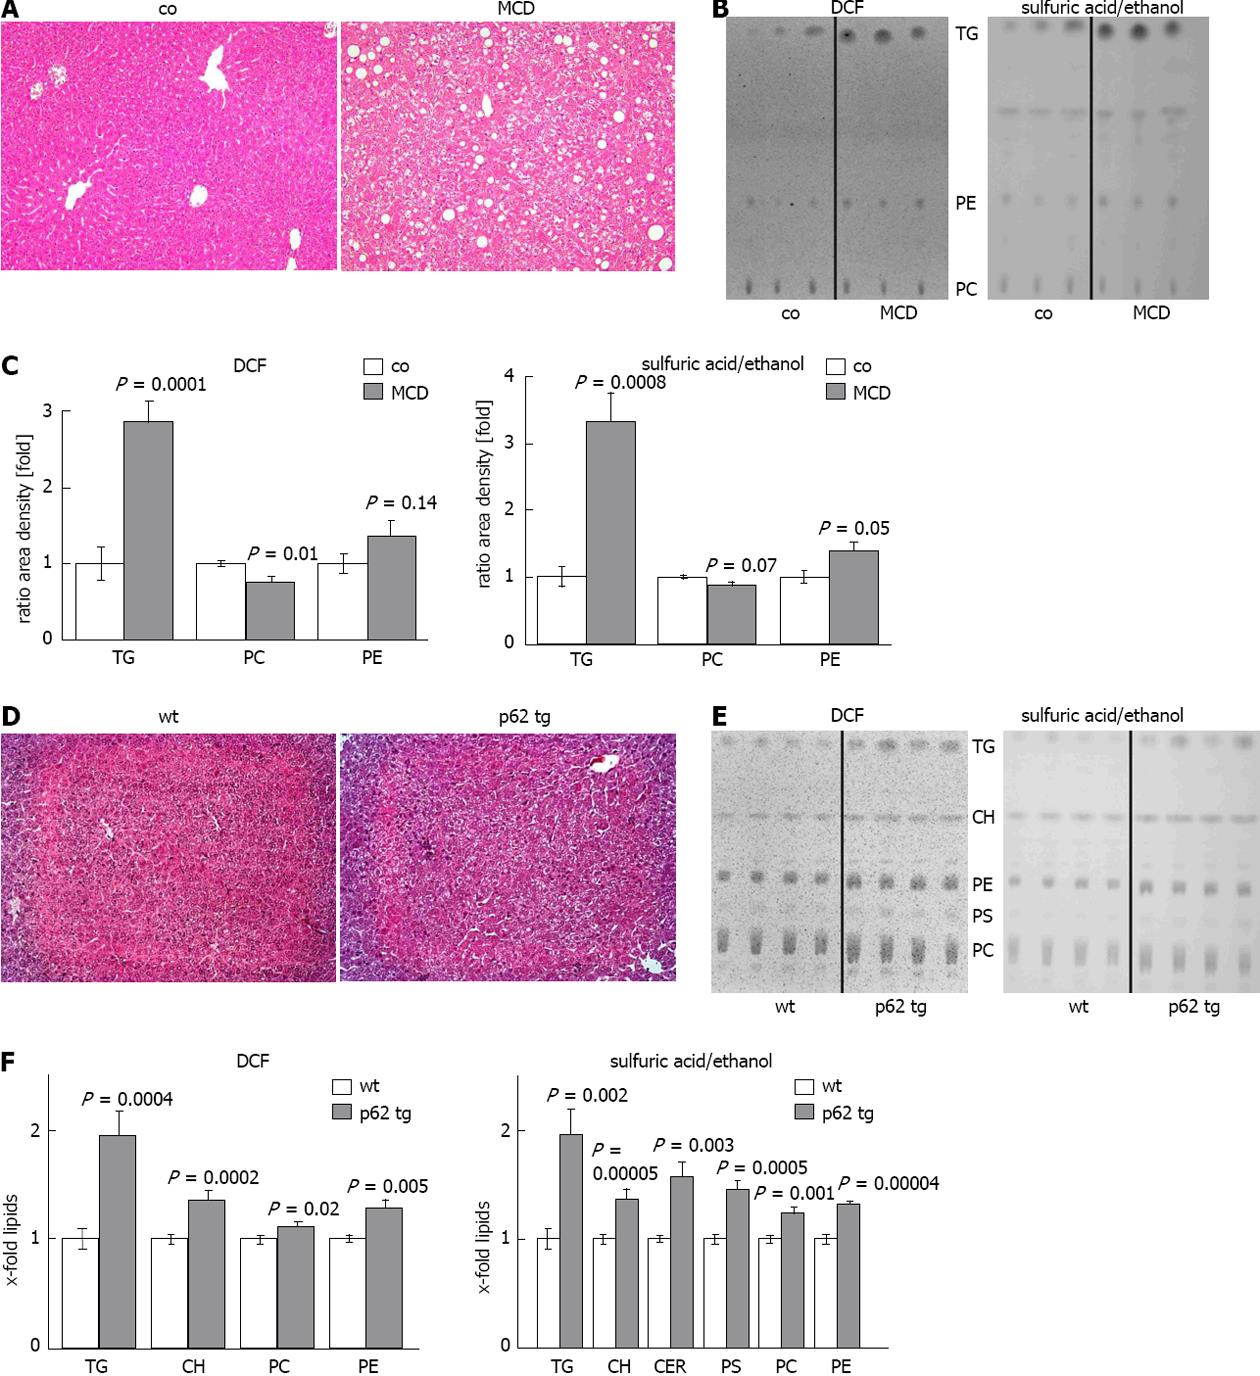
Figure 3 Lipid quantification in different mouse models.
A: Representative hematoxylin eosin (HE) staining of control (co) or methionine choline deficient diet (MCD) fed mice (× 200); B: Representative thin layer chromatography (TLC) detected with 2’,7’-dichlorofluorescein (DCF) (left) or sulfuric acid/ethanol (right); C: Quantification of TLC with ImageJ, detected with DCF (left) or sulfuric acid/ethanol (right). Results represent the mean ± SE from at least two independent TLC plates with n = 7 in each group; D: representative HE staining of wildtype (wt) and p62 transgenic mice (p62 tg)(× 200); E: Representative TLC detected with DCF (left) or sulfuric acid/ethanol (right); F: Quantification of TLC with ImageJ detected with DCF (left) or sulfuric acid/ethanol (right). Results represent the mean ± SE from at least two independent TLC plates and n = 4 in each group.
- Citation: Laggai S, Simon Y, Ranssweiler T, Kiemer AK, Kessler SM. Rapid chromatographic method to decipher distinct alterations in lipid classes in NAFLD/NASH. World J Hepatol 2013; 5(10): 558-567
- URL: https://www.wjgnet.com/1948-5182/full/v5/i10/558.htm
- DOI: https://dx.doi.org/10.4254/wjh.v5.i10.558


