Copyright
©2013 Baishideng Publishing Group Co.
World J Hepatol. Oct 27, 2013; 5(10): 558-567
Published online Oct 27, 2013. doi: 10.4254/wjh.v5.i10.558
Published online Oct 27, 2013. doi: 10.4254/wjh.v5.i10.558
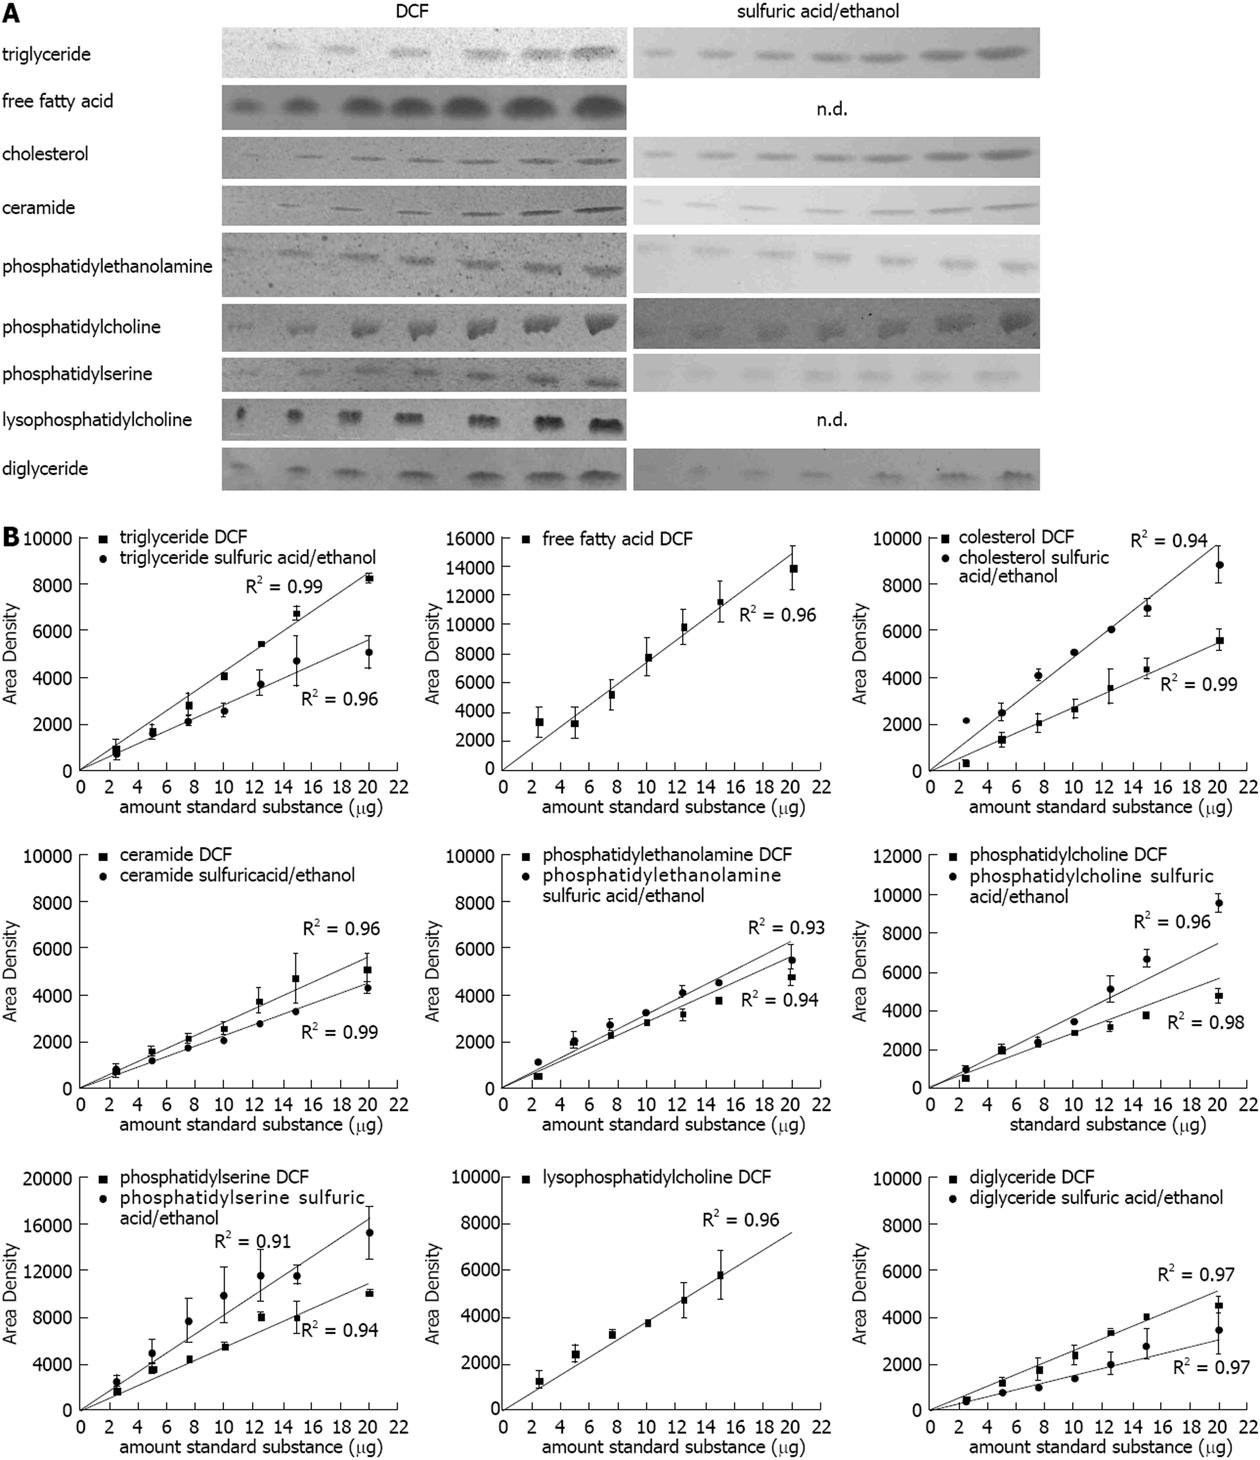
Figure 1 Quantification of lipids on the thin layer chromatography plate.
A: Representative lipid dilution series (range: 2.5, 5, 7.5, 10, 12.5, 15, 20 μg) detected with 2’,7’-dichlorofluorescein (DCF) or sulfuric acid/ethanol; B: Quantification of the standard dilution series detected with DCF or sulfuric acid/ethanol and quantified with ImageJ. Results represent the mean ± SE from at least two independent thin layer chromatography plates. FFA: Free fatty acids.
- Citation: Laggai S, Simon Y, Ranssweiler T, Kiemer AK, Kessler SM. Rapid chromatographic method to decipher distinct alterations in lipid classes in NAFLD/NASH. World J Hepatol 2013; 5(10): 558-567
- URL: https://www.wjgnet.com/1948-5182/full/v5/i10/558.htm
- DOI: https://dx.doi.org/10.4254/wjh.v5.i10.558


