Copyright
©2012 Baishideng Publishing Group Co.
World J Hepatol. Apr 27, 2012; 4(4): 139-148
Published online Apr 27, 2012. doi: 10.4254/wjh.v4.i4.139
Published online Apr 27, 2012. doi: 10.4254/wjh.v4.i4.139
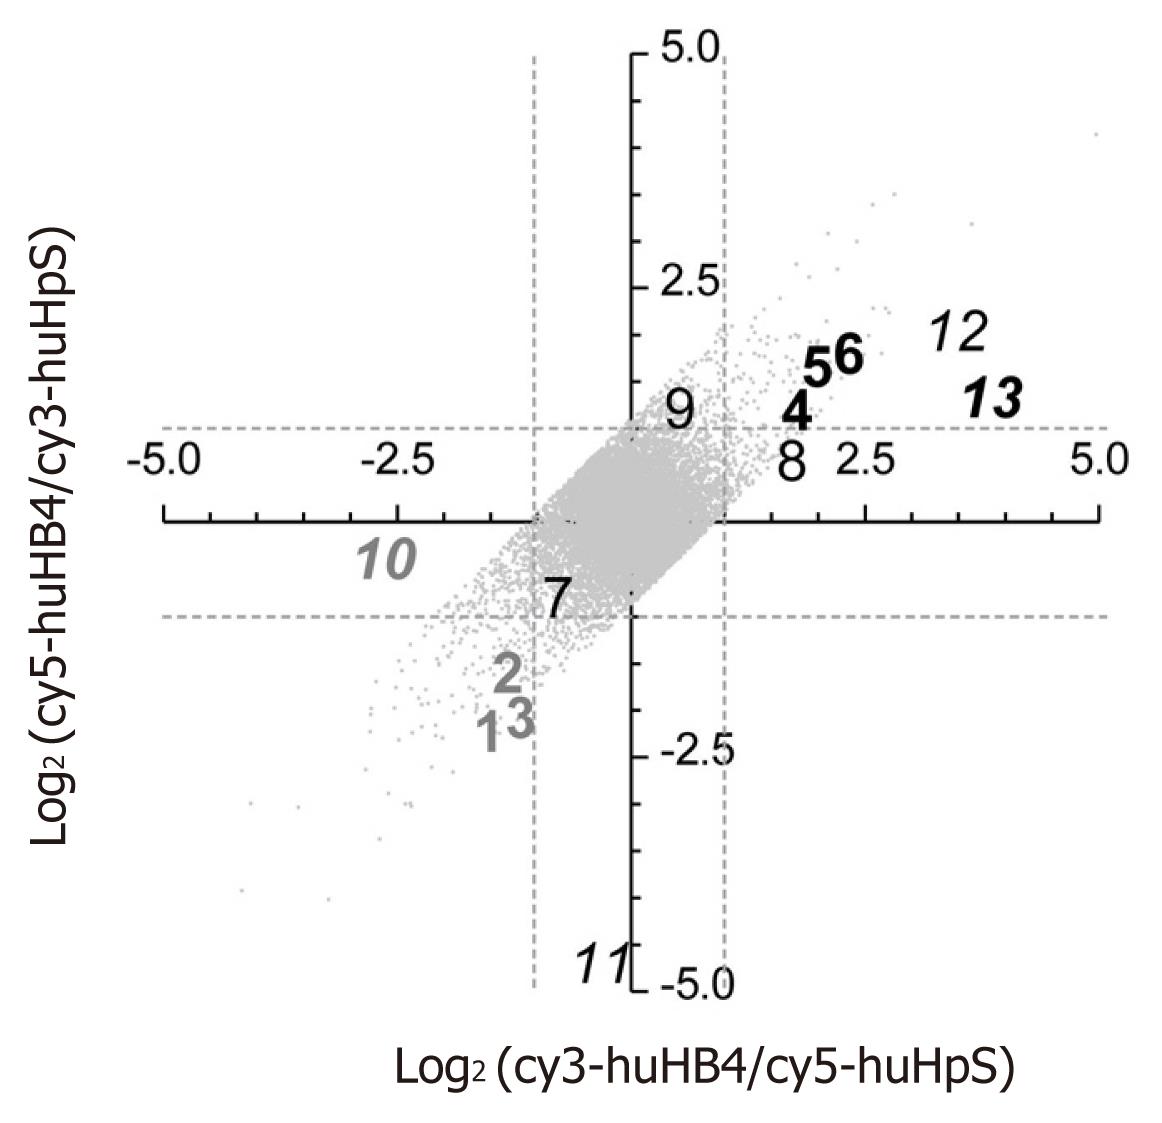
Figure 2 Log2 plot of flip-dye conversion in microarray analysis between huHpS and huHB4.
Total RNAs from huHpS and huHB4 were labeled with cy3/cy5, or vice versa, and subjected to a human 30 K cDNA microarray. Log2 ratios of the intensities in each labeling combination were plotted after LOWESS normalization as long as signal intensities were consistent between dye-flipping with less than a twofold difference. In total, 13 012 spots were plotted, and the dotted lines indicate a log2 intensity ratio of 1 or -1. Numbers 1 to 13 indicate the spots that were randomly selected for further quantitative reverse transcription-polymerase chain reaction evaluation. Bold gray and black numbers represent the spots that were found to show a twofold higher or lower intensity in huHB4 compared with huHpS by both microarray and quantitative RT-PCR analyses. Italicized numbers indicate the flip-inconsistent spots. RT-PCR: Real-time reverse transcription-polymerase chain reaction.
- Citation: Fukuhara Y, Suda T, Kobayashi M, Tamura Y, Igarashi M, Waguri N, Kawai H, Aoyagi Y. Identification of cellular genes showing differential expression associated with hepatitis B virus infection. World J Hepatol 2012; 4(4): 139-148
- URL: https://www.wjgnet.com/1948-5182/full/v4/i4/139.htm
- DOI: https://dx.doi.org/10.4254/wjh.v4.i4.139


