Copyright
©2010 Baishideng.
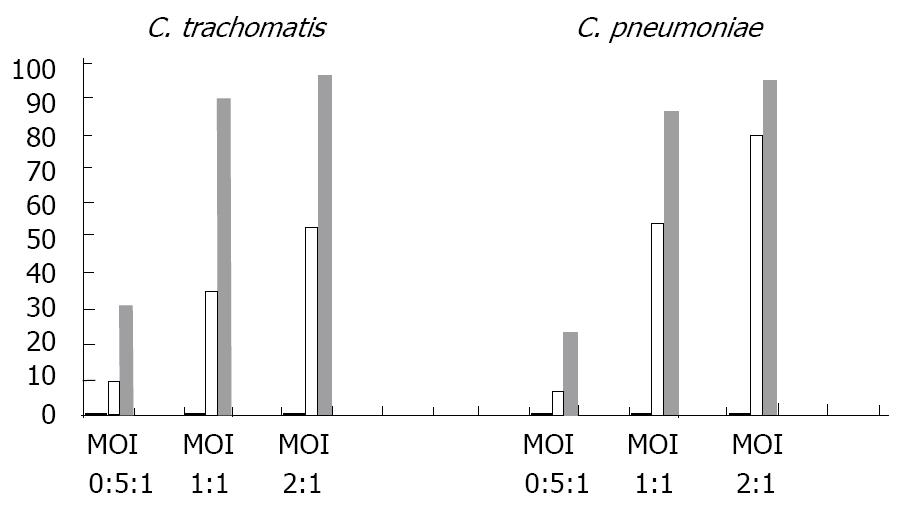
Figure 5 Flow Cytometry Analysis of HepG2 cells.
Infectivity of C. pneumoniae and C. trachomatis preincubated with native ApoB-containing lipoproteins. HepG2 cells were infected with C. pneumoniae (left side of diagram) or C. trachomatis (right side of diagram) with or without preincubation of bacteria with native ApoB-containing lipoproteins as described in Material Methods. Three different levels of infection multiplicity were studied for each pathogen (MOI 0.5:1; 1:1; 2:1). Percentage of the infected cells shown on value Y axis was determined by flow cytometry (see Materials and Methods) for control (uninfected) HepG2 suspensions (hardly seen black columns), HepG2 suspensions infected with chlamydia bacteria alone (white columns) and HepG2 suspensions infected with chlamydial bacteria preincubated with native ApoB-containing lipoproteins (gray columns).
- Citation: Bashmakov YK, Zigangirova NA, Gintzburg AL, Bortsov PA, Petyaev IM. ApoB-containing lipoproteins promote infectivity of chlamydial species in human hepatoma cell line. World J Hepatol 2010; 2(2): 74-80
- URL: https://www.wjgnet.com/1948-5182/full/v2/i2/74.htm
- DOI: https://dx.doi.org/10.4254/wjh.v2.i2.74


