Copyright
©2010 Baishideng.
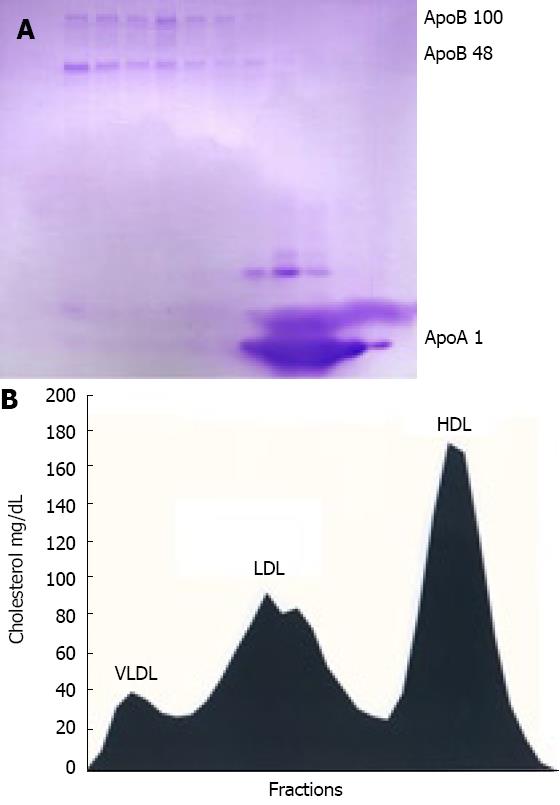
Figure 1 FPLC fractionation of mouse plasma.
Mice kept on high-fat diet were bled and pooled plasma was adjusted with KBr to d = 1.215 g/mL and ultracentrifuged. Resulting lipoprotein fraction with density d < 1.215 g/mL was subjected to FPLC gel filtration and cholesterol content was measured in each fraction. Three of each consecutive fraction were pooled, delipidated, heat-denatured and subjected to SDS PAGE gel electrophoresis in gradient gel as described in “Material and Methods”. A: Coomassie blue-stained gel with ApoB-100, ApoB-48 and ApoAI indicated by arrow; B: Cholesterol levels in FPLC fractions aligned to apolipoprotein profile of mouse plasma.
- Citation: Bashmakov YK, Zigangirova NA, Gintzburg AL, Bortsov PA, Petyaev IM. ApoB-containing lipoproteins promote infectivity of chlamydial species in human hepatoma cell line. World J Hepatol 2010; 2(2): 74-80
- URL: https://www.wjgnet.com/1948-5182/full/v2/i2/74.htm
- DOI: https://dx.doi.org/10.4254/wjh.v2.i2.74


