Copyright
©The Author(s) 2025.
World J Hepatol. Mar 27, 2025; 17(3): 97767
Published online Mar 27, 2025. doi: 10.4254/wjh.v17.i3.97767
Published online Mar 27, 2025. doi: 10.4254/wjh.v17.i3.97767
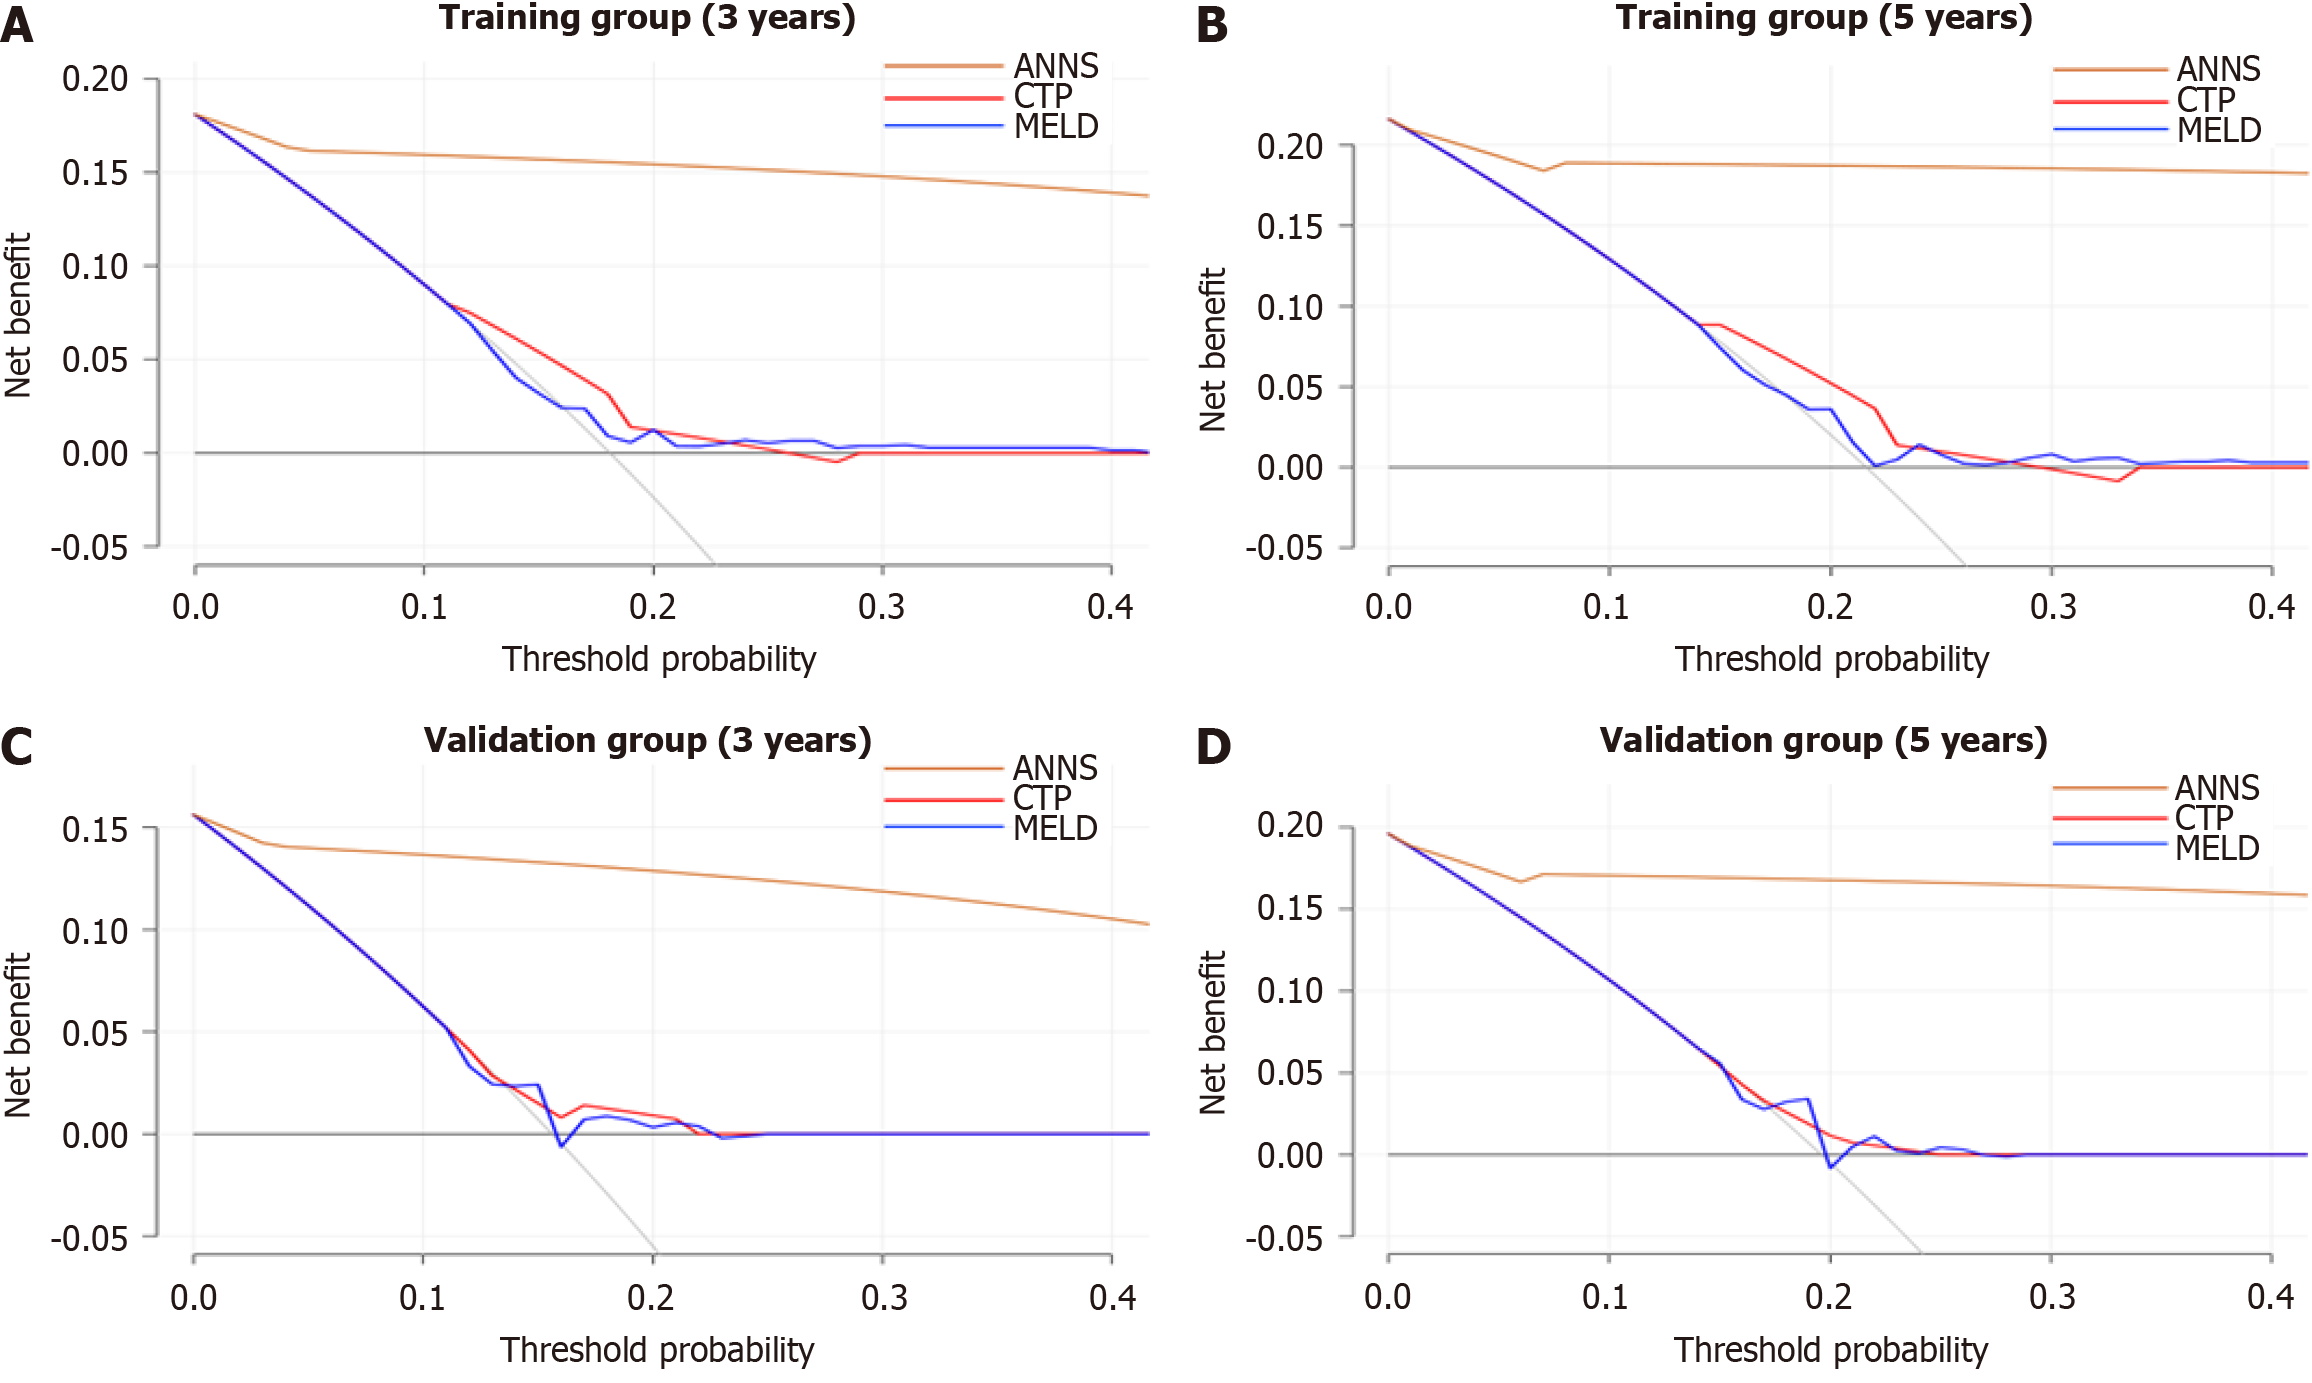
Figure 4 Predicted vs observed cumulative incidence of portal vein thrombosis based on the predictive model.
A: The decision curve analysis (DCA) curve comparing the artificial neural network (ANN) model with other models for predicting the occurrence of portal vein thrombosis (PVT) within three years in the training group; B: The DCA curve comparing the ANN model with other models for predicting the occurrence of PVT within five years in the training group; C: The DCA curve comparing the ANN model with other models for predicting the occurrence of PVT within three years in the validation group; D: The DCA curve comparing the ANN model with other models for predicting the occurrence of PVT within five years in the validation group.
- Citation: Meng PP, Xiong FX, Chen JL, Zhou Y, Liu XL, Ji XM, Jiang YY, Hou YX. Establish and validate an artificial neural networks model used for predicting portal vein thrombosis risk in hepatitis B-related cirrhosis patients. World J Hepatol 2025; 17(3): 97767
- URL: https://www.wjgnet.com/1948-5182/full/v17/i3/97767.htm
- DOI: https://dx.doi.org/10.4254/wjh.v17.i3.97767


