Copyright
©The Author(s) 2025.
World J Hepatol. Mar 27, 2025; 17(3): 97767
Published online Mar 27, 2025. doi: 10.4254/wjh.v17.i3.97767
Published online Mar 27, 2025. doi: 10.4254/wjh.v17.i3.97767
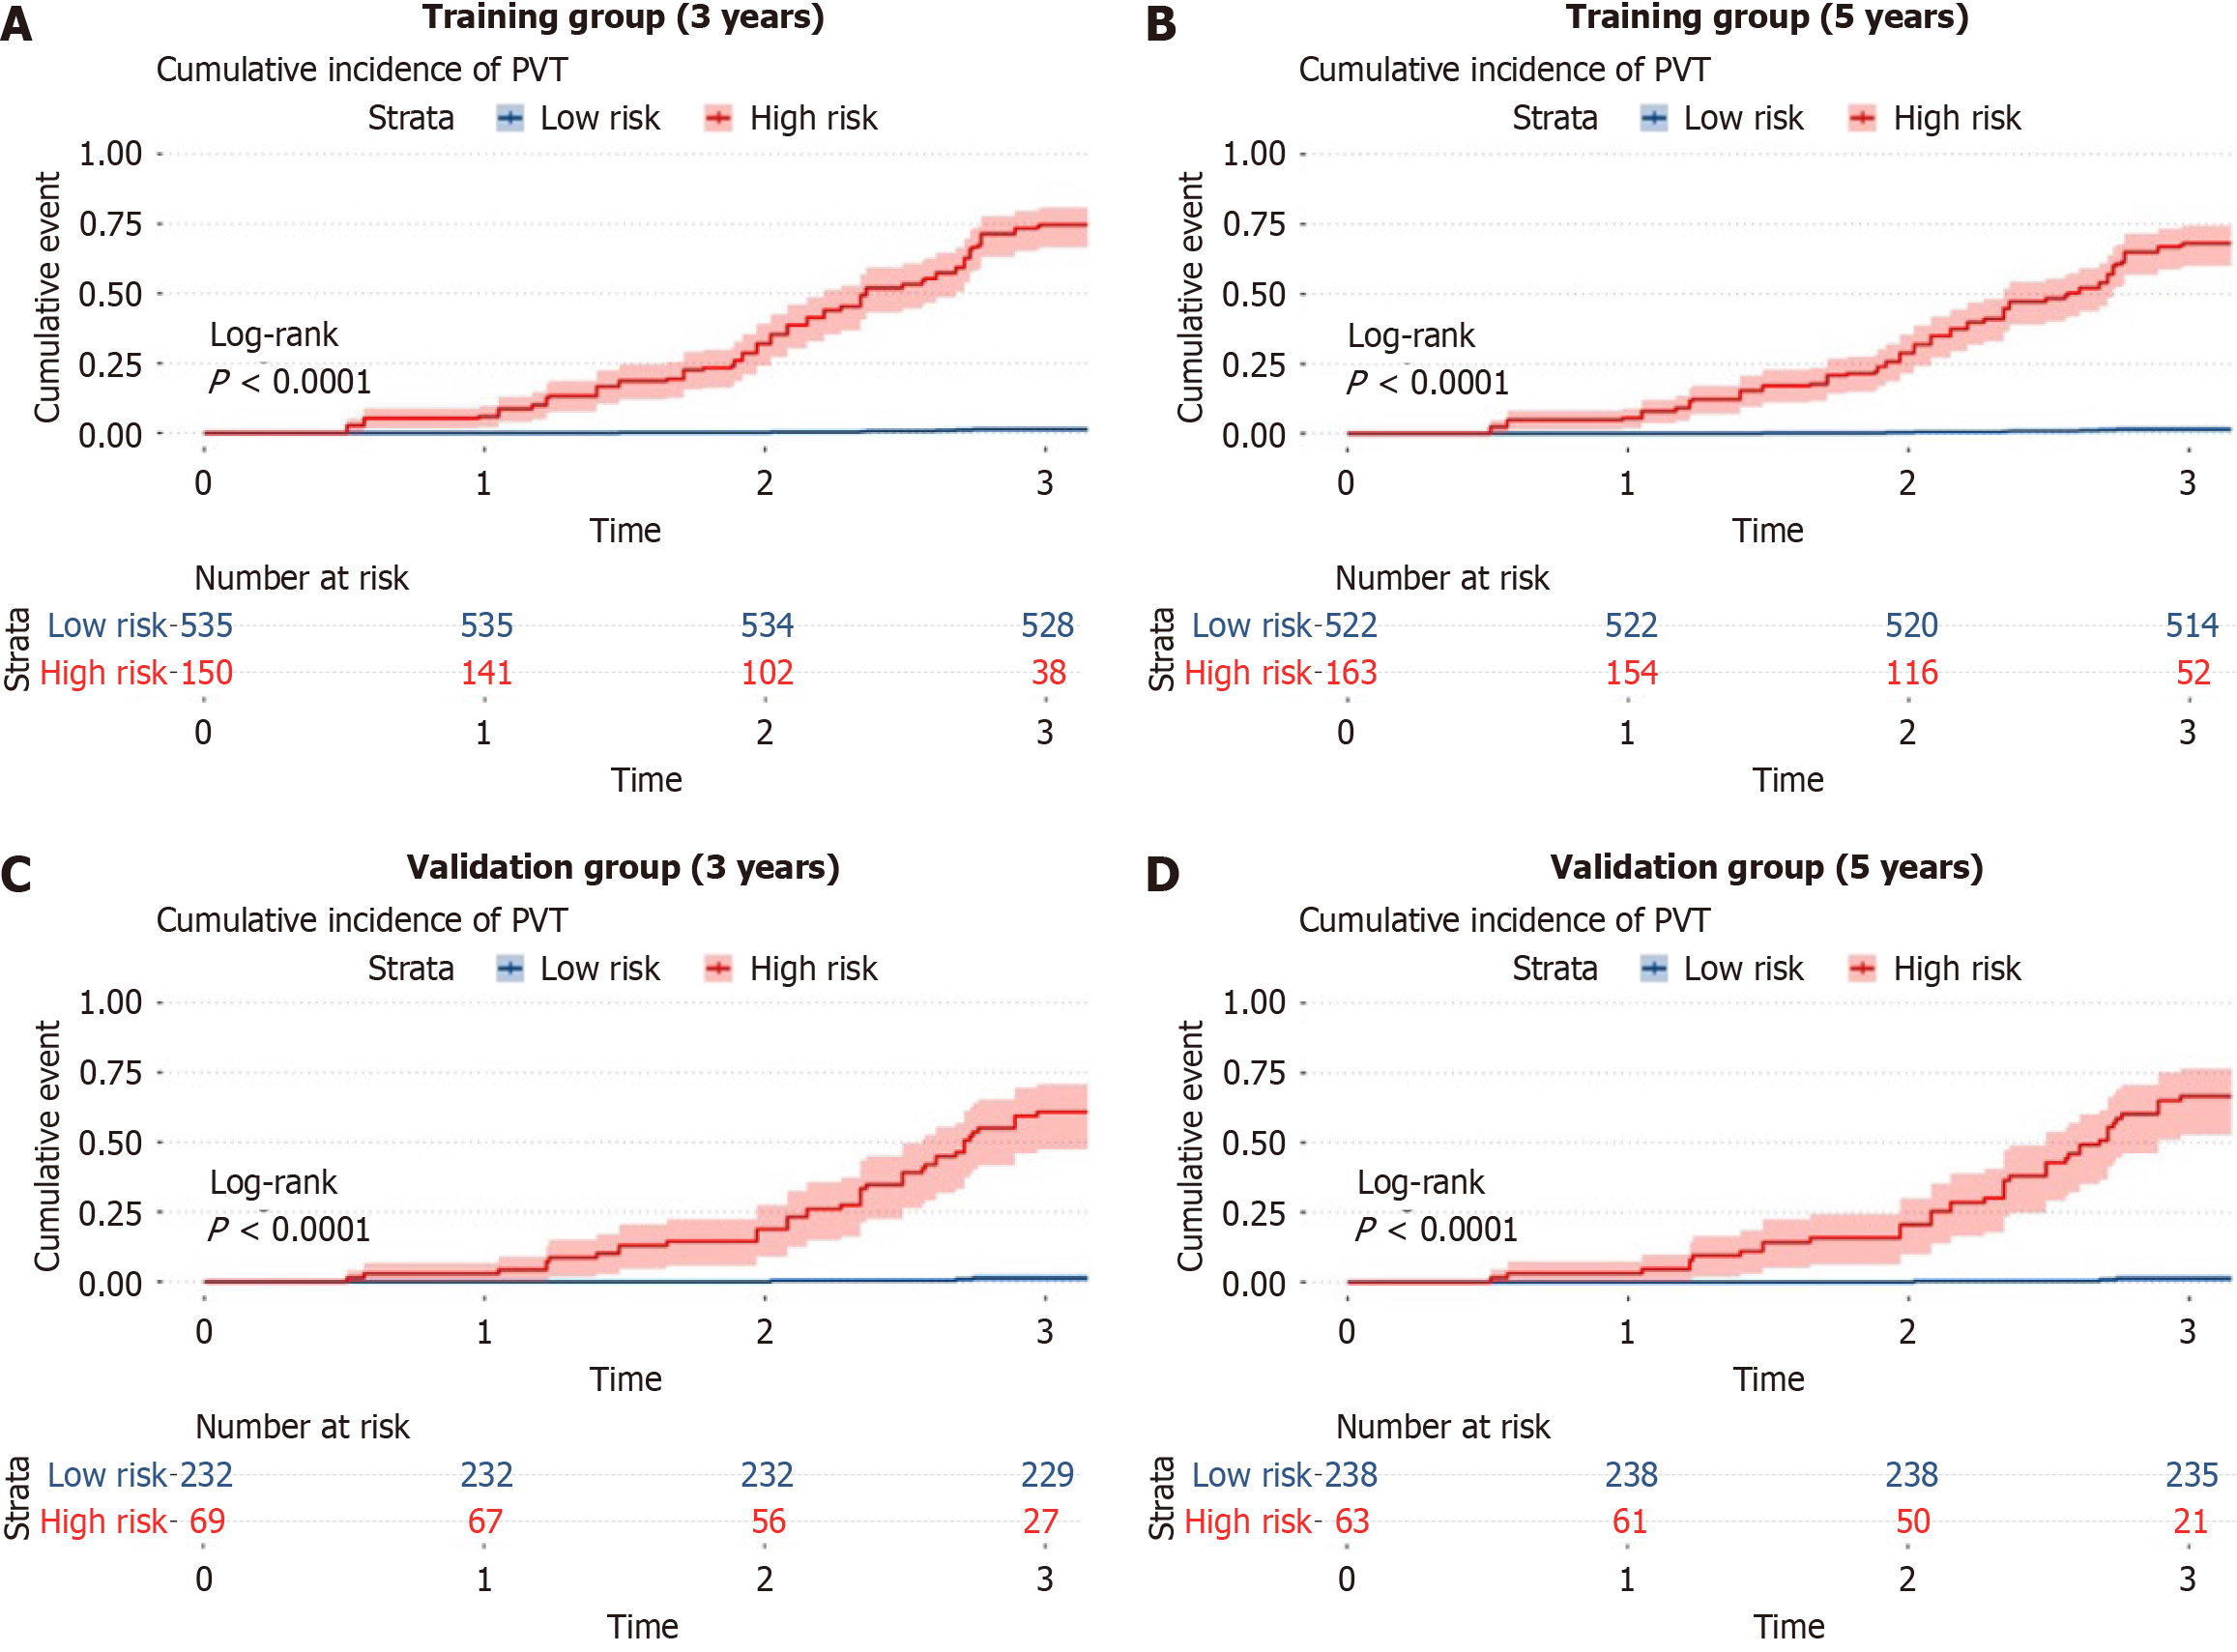
Figure 3 According to the artificial neural network model, the patient training and validation sets are divided into two risk layers as follows: High and low through Kaplan–Meier method.
A: The Kaplan–Meier (KM) curve for the risk of the occurrence of portal vein thrombosis (PVT) through the artificial neural network (ANN) model within three years in the training group; B: The KM curve for the risk of the occurrence of PVT through the ANN model within five years in the training group; C: The KM curve for the risk of the occurrence of PVT through the ANN model within three years in the validation group; D: The KM curve for the risk of the occurrence of PVT through the ANN model within five years in the validation group.
- Citation: Meng PP, Xiong FX, Chen JL, Zhou Y, Liu XL, Ji XM, Jiang YY, Hou YX. Establish and validate an artificial neural networks model used for predicting portal vein thrombosis risk in hepatitis B-related cirrhosis patients. World J Hepatol 2025; 17(3): 97767
- URL: https://www.wjgnet.com/1948-5182/full/v17/i3/97767.htm
- DOI: https://dx.doi.org/10.4254/wjh.v17.i3.97767


