Copyright
©The Author(s) 2025.
World J Hepatol. Mar 27, 2025; 17(3): 103327
Published online Mar 27, 2025. doi: 10.4254/wjh.v17.i3.103327
Published online Mar 27, 2025. doi: 10.4254/wjh.v17.i3.103327
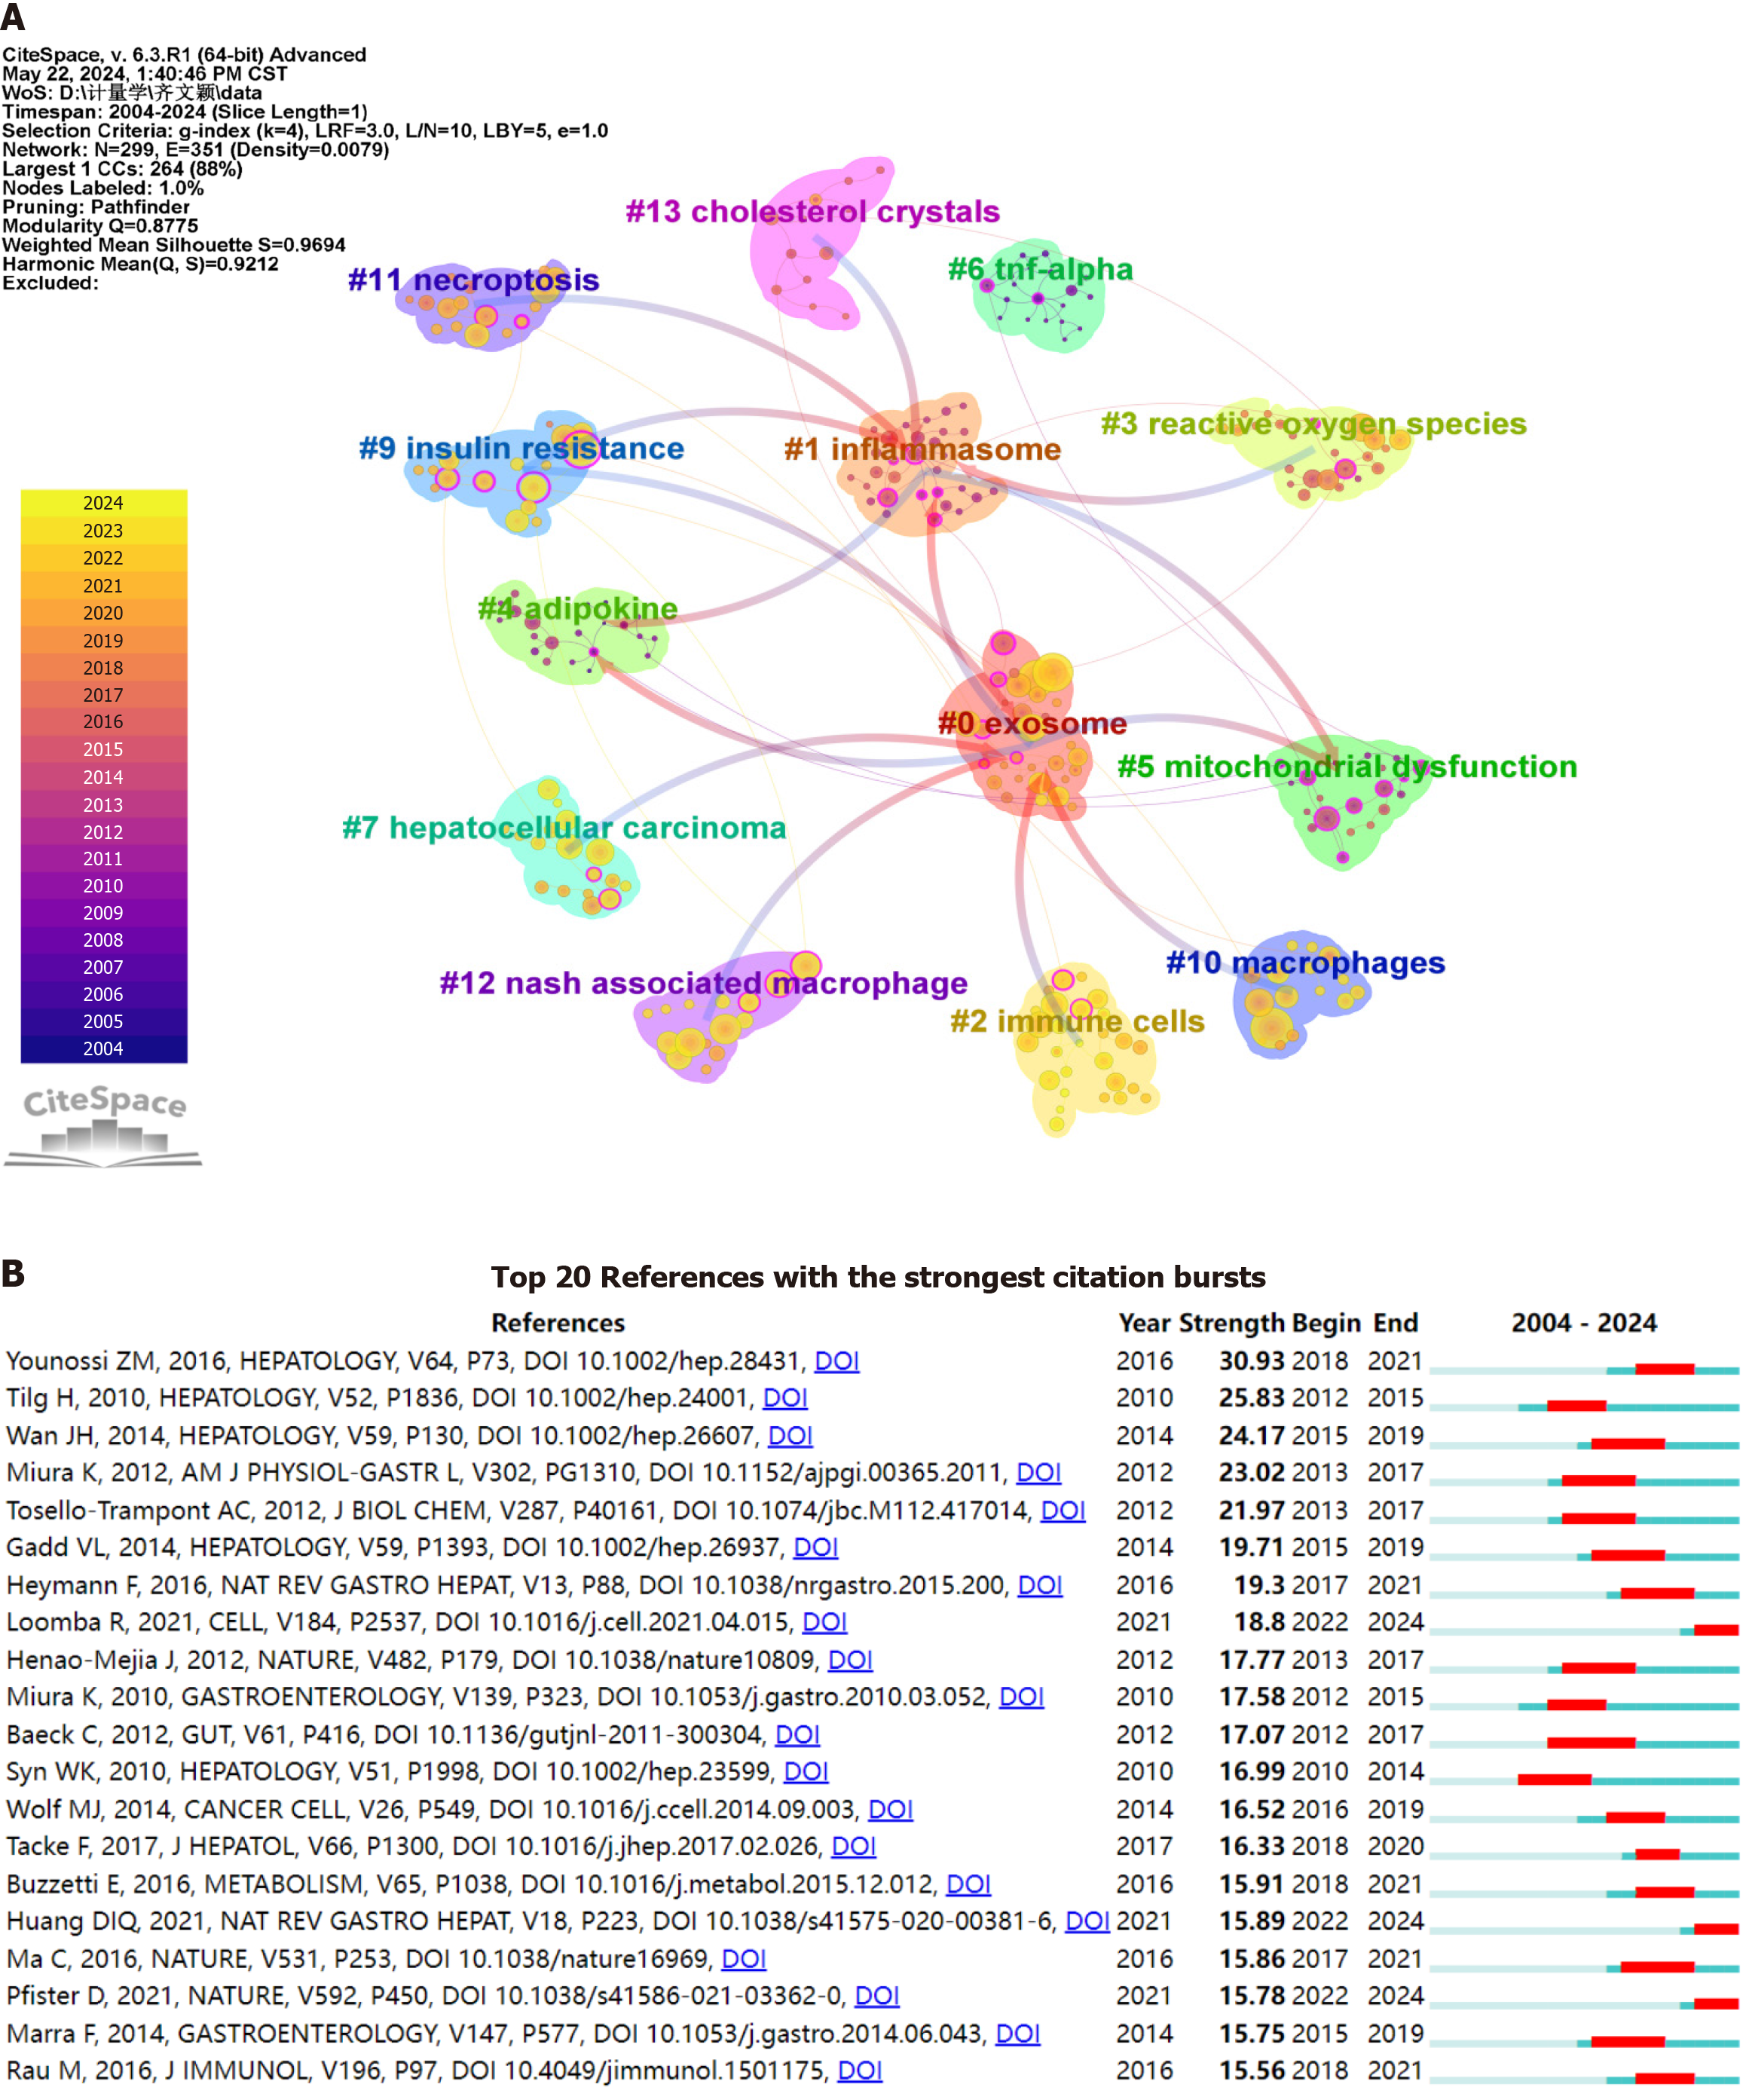
Figure 5 Co-citation clustering and citation burst analysis.
A: Cluster analysis map of co-cited references. The parameters in CiteSpace were set as follows: Time slicing (2004-2024), one year per slice, and selection criterion (k = 4). The size of the superimposed rings (i.e., the cumulative size of the rings on the timeline) is proportional to the number of co-citations. Purple indicates relatively early citation years, while yellow indicates more recent citation years. Overlapping colors suggest that the article was cited in each corresponding year. Lines between circles represent co-citation relationships. Nodes marked in magenta are key nodes with centrality greater than 0.1; B: Citation burst analysis map. A citation burst refers to a significant increase in the number of citations a particular article receives within a specific time frame. The red areas in the graph indicate the periods during which the citations of each article surged.
- Citation: Qi WY, Zheng SH, Li SZ, Wang W, Wang QY, Liu QY, Li XK, Zhang JX, Gan DN, Ye YA, Zao XB. Immune cells in metabolic associated fatty liver disease: Global trends and hotspots (2004-2024). World J Hepatol 2025; 17(3): 103327
- URL: https://www.wjgnet.com/1948-5182/full/v17/i3/103327.htm
- DOI: https://dx.doi.org/10.4254/wjh.v17.i3.103327


