Copyright
©The Author(s) 2025.
World J Hepatol. Mar 27, 2025; 17(3): 103327
Published online Mar 27, 2025. doi: 10.4254/wjh.v17.i3.103327
Published online Mar 27, 2025. doi: 10.4254/wjh.v17.i3.103327
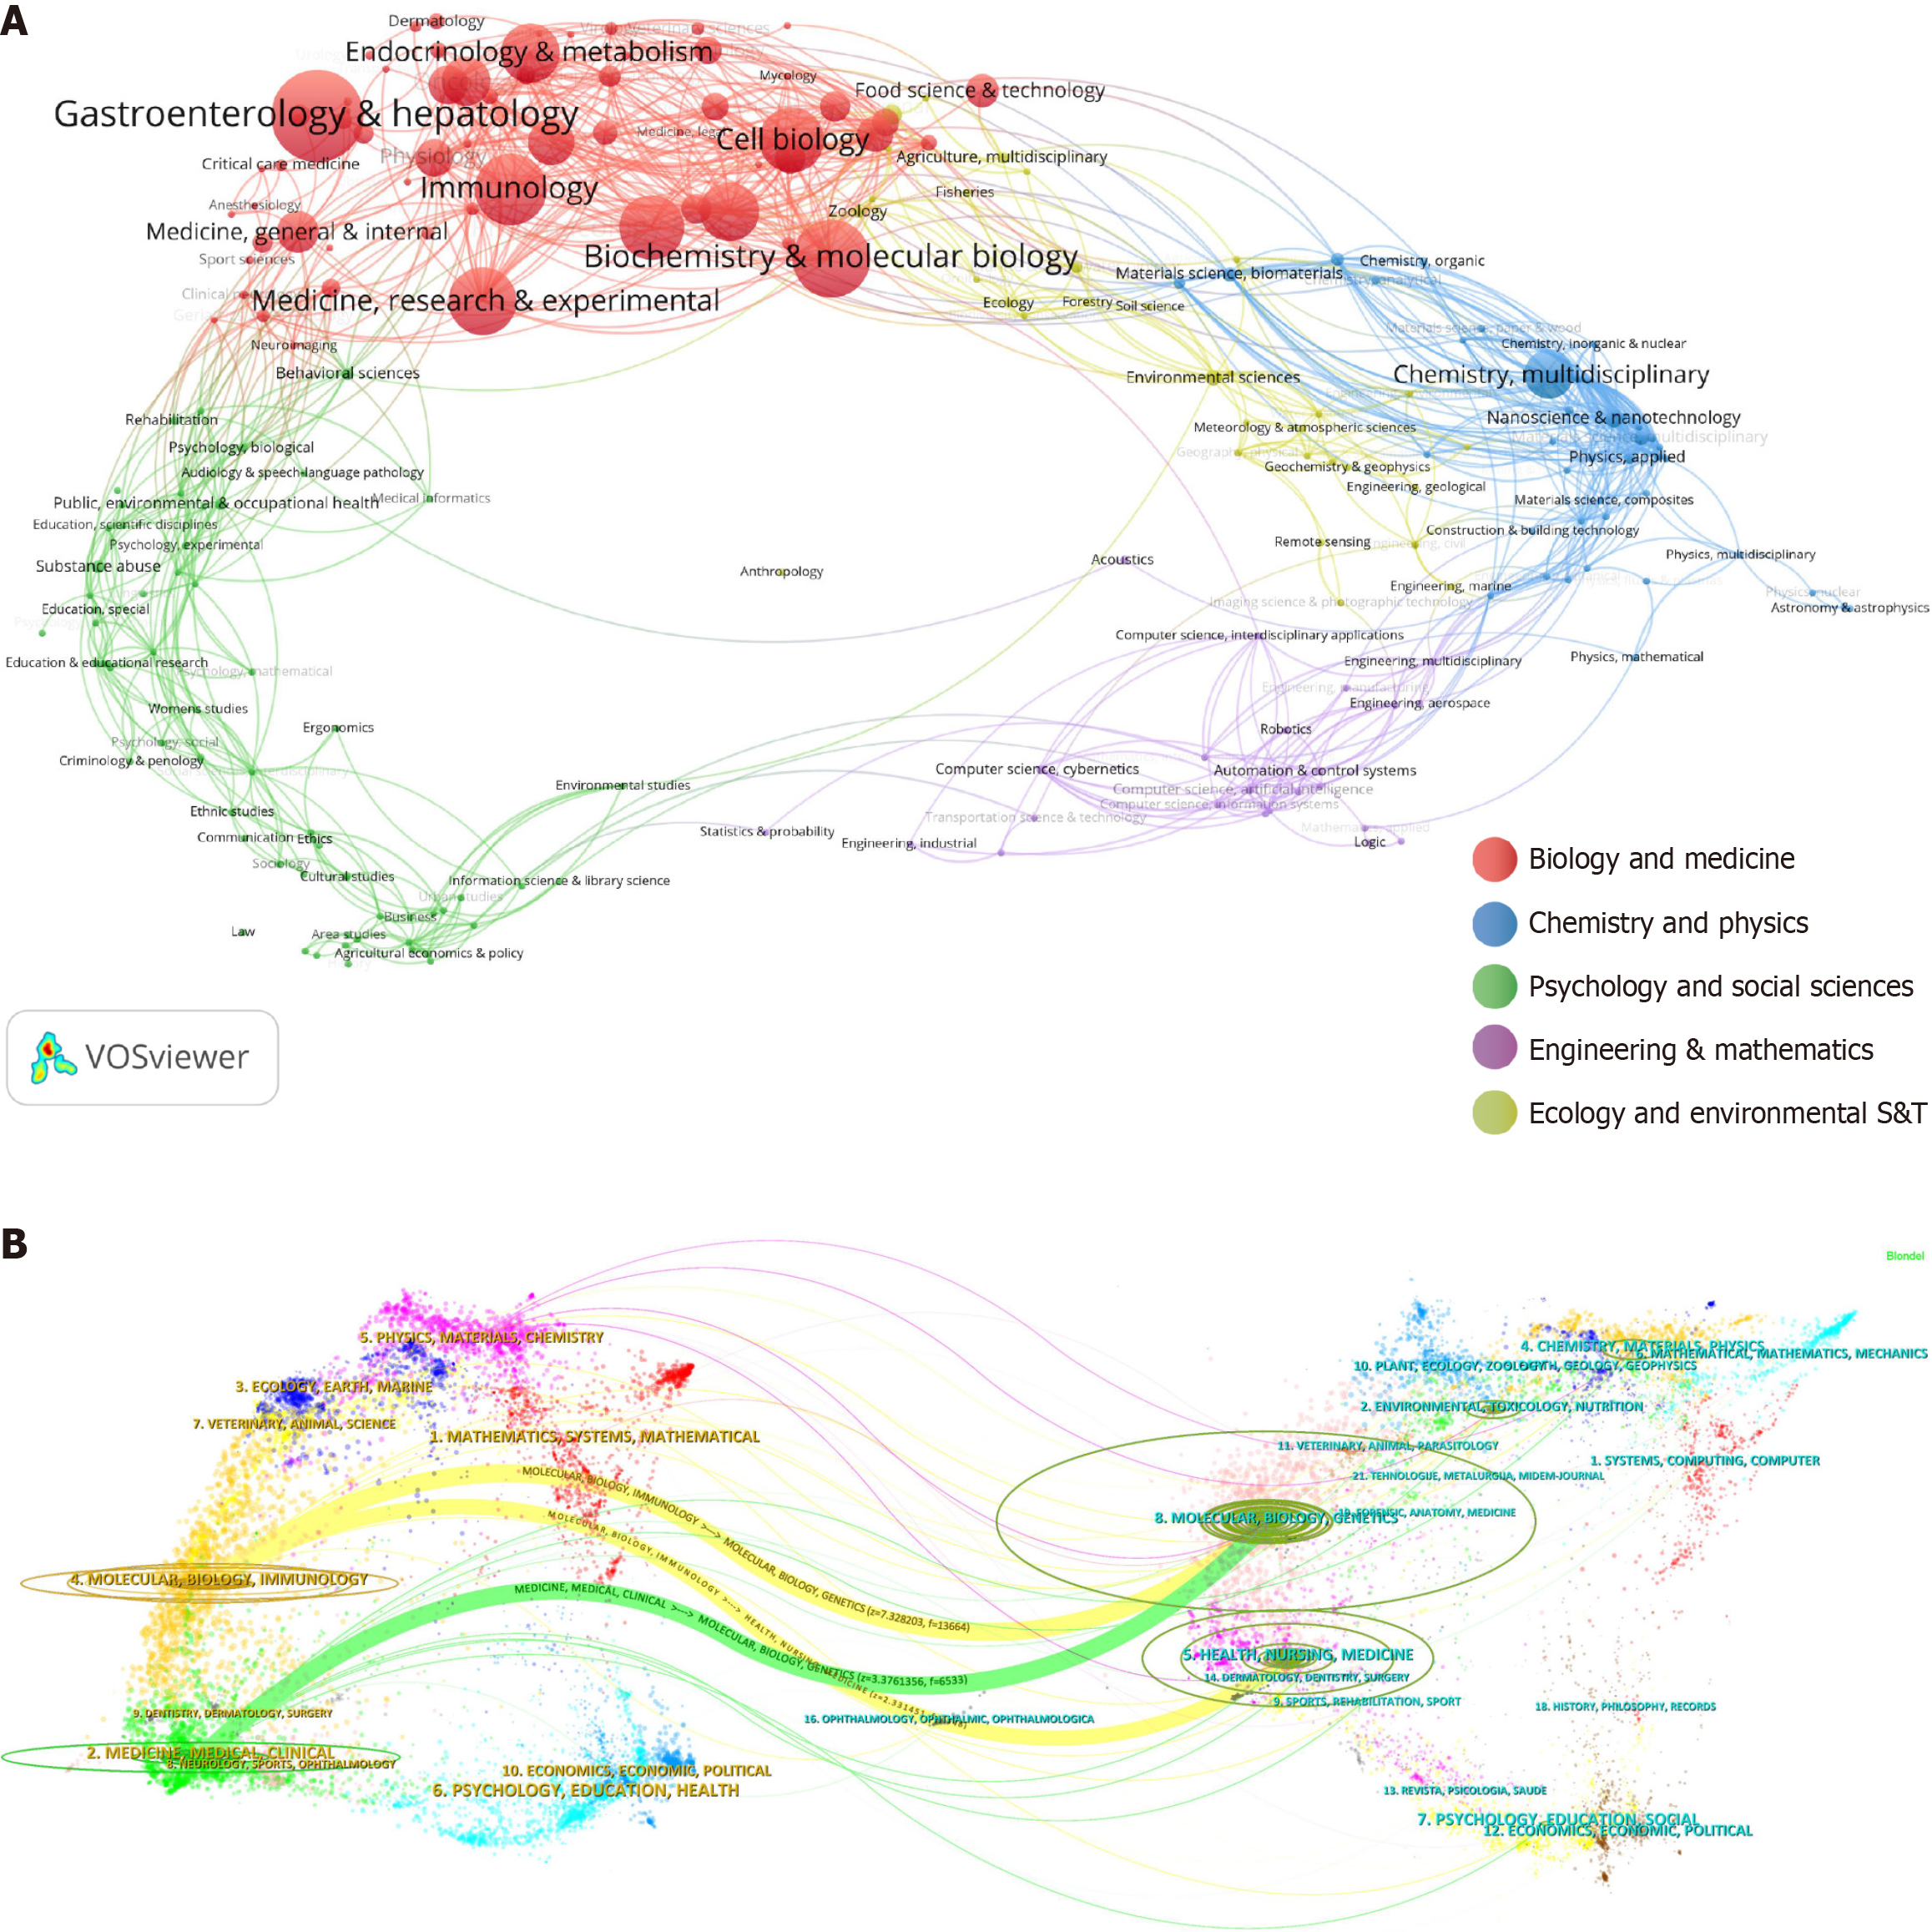
Figure 4 Distribution of disciplines and journals.
A: Field analysis chart. The VOSviewer software was used for visualization analysis, clustering the 1936 articles into five major fields; B: Dual-map overlay of journals. The figure is divided into two parts: The left side represents the citing journals, and the right side represents the cited journals. The more papers a journal publishes, the longer the vertical axis of the ellipse; the more authors involved, the longer the horizontal axis of the ellipse.
- Citation: Qi WY, Zheng SH, Li SZ, Wang W, Wang QY, Liu QY, Li XK, Zhang JX, Gan DN, Ye YA, Zao XB. Immune cells in metabolic associated fatty liver disease: Global trends and hotspots (2004-2024). World J Hepatol 2025; 17(3): 103327
- URL: https://www.wjgnet.com/1948-5182/full/v17/i3/103327.htm
- DOI: https://dx.doi.org/10.4254/wjh.v17.i3.103327


